Views
Regenerator 2000 splits the workspace into the Disassembly View on the left and a switchable companion view on the right (Blocks, Hexdump, Sprites, Charset, Bitmap, or Debugger). Press Tab anytime to move focus between panes.
All scrollable views share standard cursor navigation:
| Action | Shortcut |
|---|---|
| Move Cursor | Up / Down / J / K |
| Page Up / Down | Page Up / Page Down or Ctrl+U / Ctrl+D |
| Start / End | Home / End |
| Jump to Item / End | number + Shift+G |
| Switch Pane | Tab |
Disassembly View
The Disassembly View is your primary workspace for decoding instructions, defining data blocks, adding comments, and tracing control flow:
- Control-Flow Margin: Draws jump and branch arrows alongside the listing and dims unreferenced code blocks for visual contrast.
- Interactive Minimap: Displays block classification across the entire address space just below the menu bar—click anywhere on it to jump directly.
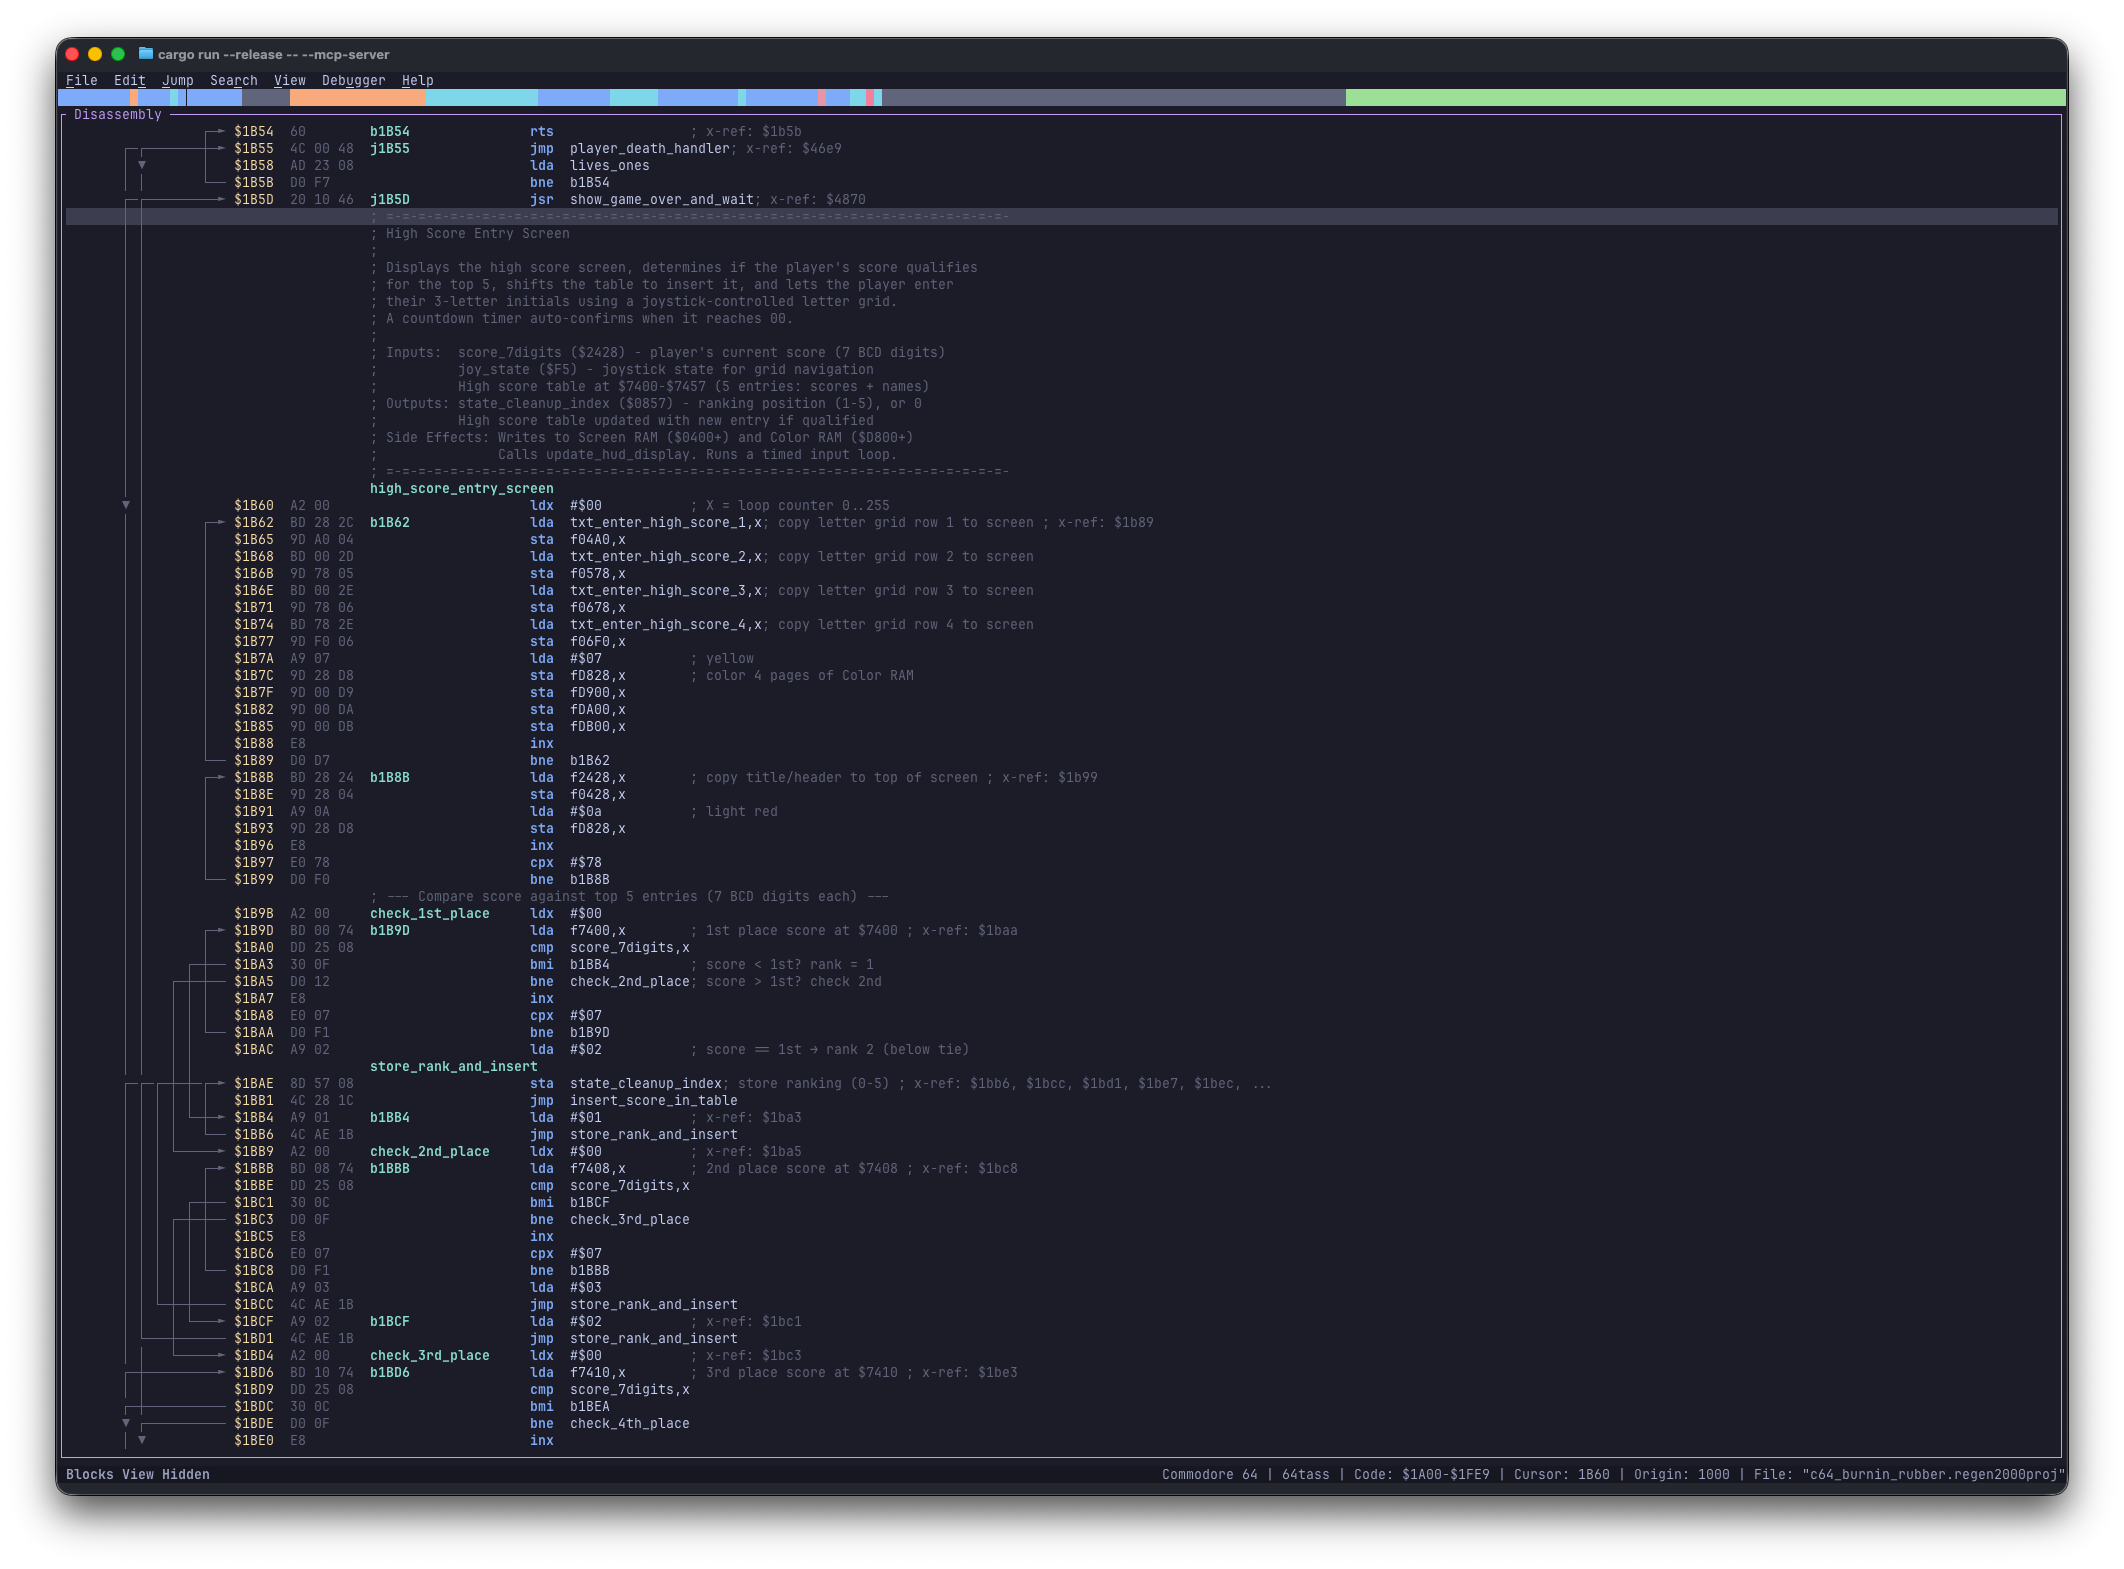
Split workspace with the Disassembly View on the left and the Hexdump companion pane on the right.
Column Anatomy
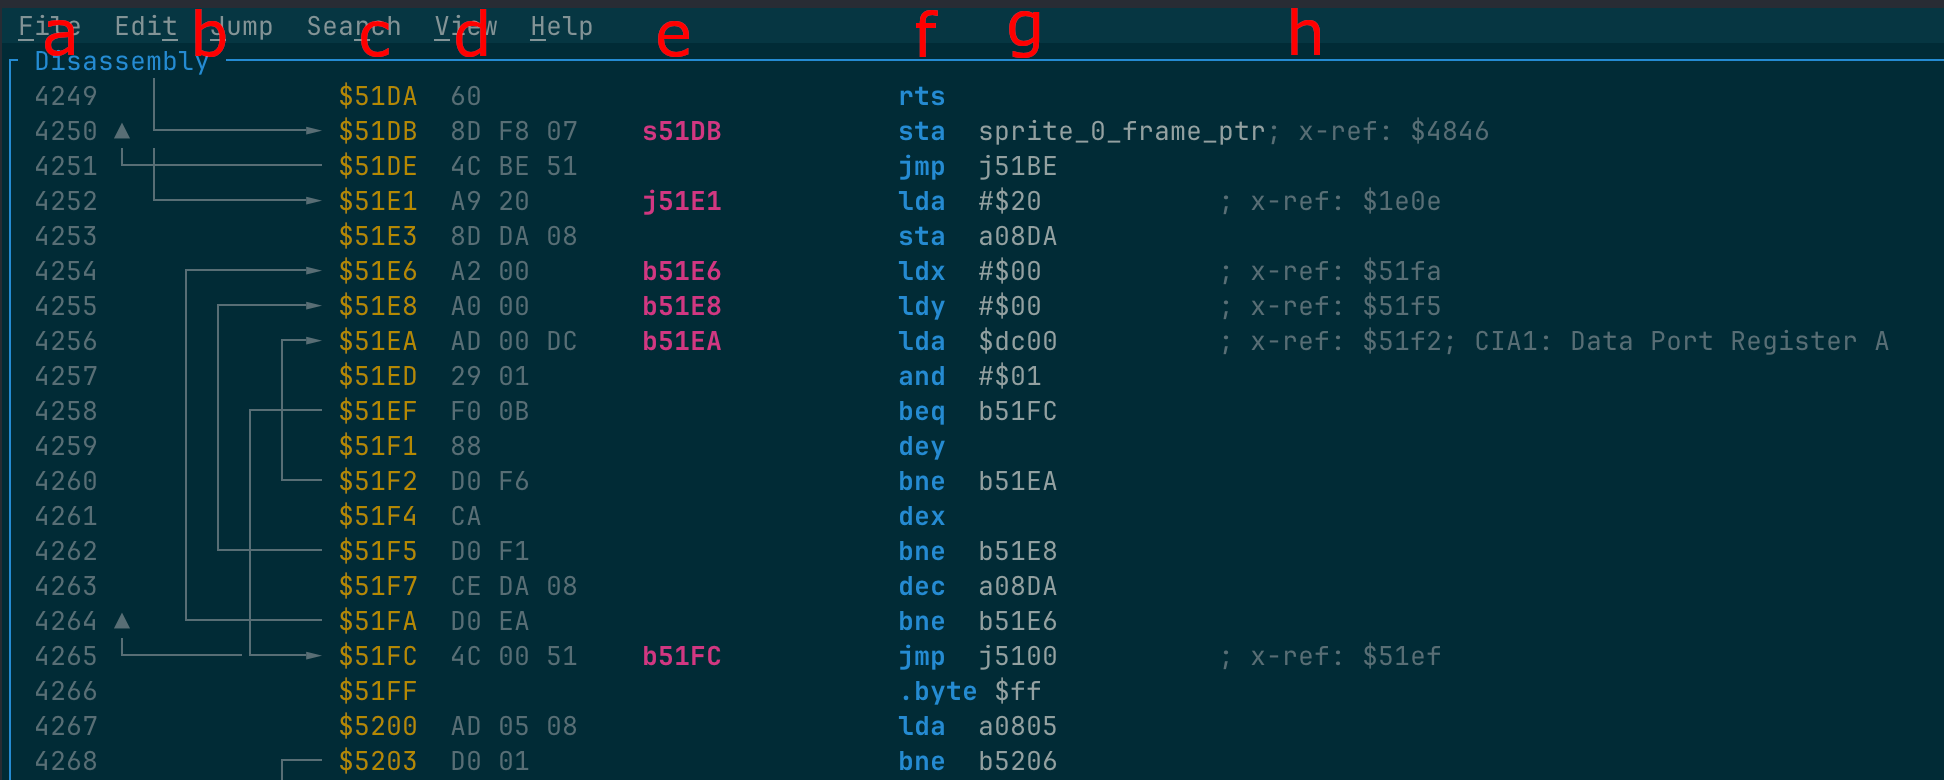
Column breakdown (a–h) in the Disassembly View.
a— Line number- Decimal row index used for line-number jumps.
b— Flow arrows- Jump and branch paths rendered along the left margin.
c— Address- Hexadecimal memory address (
$XXXX). d— Raw bytes- Hexadecimal machine bytes for the instruction or data row.
e— Label- Optional symbol with auto-prefix (
s_,j_,a_, etc.; see Analysis — Label Prefixes). f— Mnemonic- Decoded 6502 instruction or assembler directive.
g— Operand- Target address, immediate constant, enum constant, or data values.
h— Side comment- Inline user comment, system register note, or
; x-ref:callers.
Disassembly View Keyboard Shortcuts
| Action | Shortcut |
|---|---|
| Disassemble Address (flow analysis) | D |
| Convert to Code | C |
| Convert to Byte | B |
| Convert to Word | W |
| Convert to Address | A |
| Convert to PETSCII Text | P |
| Convert to Screencode Text | S |
| Convert to External File | Shift+E |
| Convert to Undefined | ? |
| Set Lo/Hi Address Table | < |
| Set Hi/Lo Address Table | > |
| Set Lo/Hi Word Table | , |
| Set Hi/Lo Word Table | . |
| Create Scope | R |
| Remove Scope / Exclude External Address | Del |
| Nudge Scope Boundary | Alt+Up / Alt+Down |
| Set Label | L |
| Set Symbolic Offset | O |
| Increment/Decrement Symbolic Offset | + / - |
| Add Side Comment | ; |
| Add Line Comment | : |
| Next/Prev Immediate Format | I / Shift+I |
| Apply Enum | E |
| Pack Lo/Hi Address | [ |
| Pack Hi/Lo Address | ] |
| Toggle Visual Mode | Shift+V |
| Select Text | Shift+Up / Shift+Down |
| Clear Selection | Esc |
| Toggle Splitter | | |
| Toggle Collapsed Block | Ctrl+K |
| Toggle Bookmark | Ctrl+B |
| List Bookmarks | Ctrl+Shift+B or Alt+B |
| Analyze | Ctrl+A |
| Jump to Address | Ctrl+G or Alt+G |
| Jump to Line | Ctrl+Shift+G or Alt+Shift+G |
| Jump to Line / End of File | number + Shift+G |
| Jump to Operand | Enter |
| Jump Back (History) | Backspace |
| Next Unexplored Block | Ctrl+N |
| Prev Unexplored Block | Ctrl+Shift+N |
| Vim Search | / |
| Search Dialog | Ctrl+F |
| Find Next | N or F3 |
| Find Previous | Shift+N or Shift+F3 |
| Go to Symbol | Ctrl+P |
| Find Cross References | Ctrl+X |
Jump to Operand
Press Enter (or Jump → Jump to Operand) in the Disassembly View to follow an operand:
- Single target (
1): Jumps immediately and saves history (Backspace returns). Works on instructions with an address, branch, or#</#>label operand, redirected external equates, and single-targetAddress/ split-table rows. - Multiple distinct targets (
2+): Opens the Jump to Operand picker (Jump to Operand from $XXXX) for multi-entry Address rows and split address tables (.byte <.../.byte >...), listed left to right and deduplicated by resolved address. - No navigable target (
0): Displays"No valid operand to jump to"in the status bar.
(For incoming ; x-ref: callers instead of outgoing operands, press Ctrl+X for Find Cross References.)
Picker Dialog Controls
The modal shows Jump to Operand from $XXXX (with [current/total] if scrollable), [1]–[9] hotkey badges, $XXXX target addresses, operand text, and disassembly previews (or (out of range) for external targets):
- Move Selection: Up / K, Down / J (wraps at ends), Page Up / Page Down, Home / End, or mouse wheel.
- Jump: Press
1–9for targets 1–9, press Enter on the active row, or left-click any row. - Cancel: Press Esc, click
[x], or click outside the modal.
Blocks View
Toggle with Alt+1 (or Ctrl+1). Displays your project's macro layout—Code (Blue), Data (Green/Yellow), Undefined (Grey), Scopes (Scope: $XXXX - $XXXX [name]), Splitters, and Collapsed blocks (+). Click any entry or press Enter to jump there in the Disassembly View.
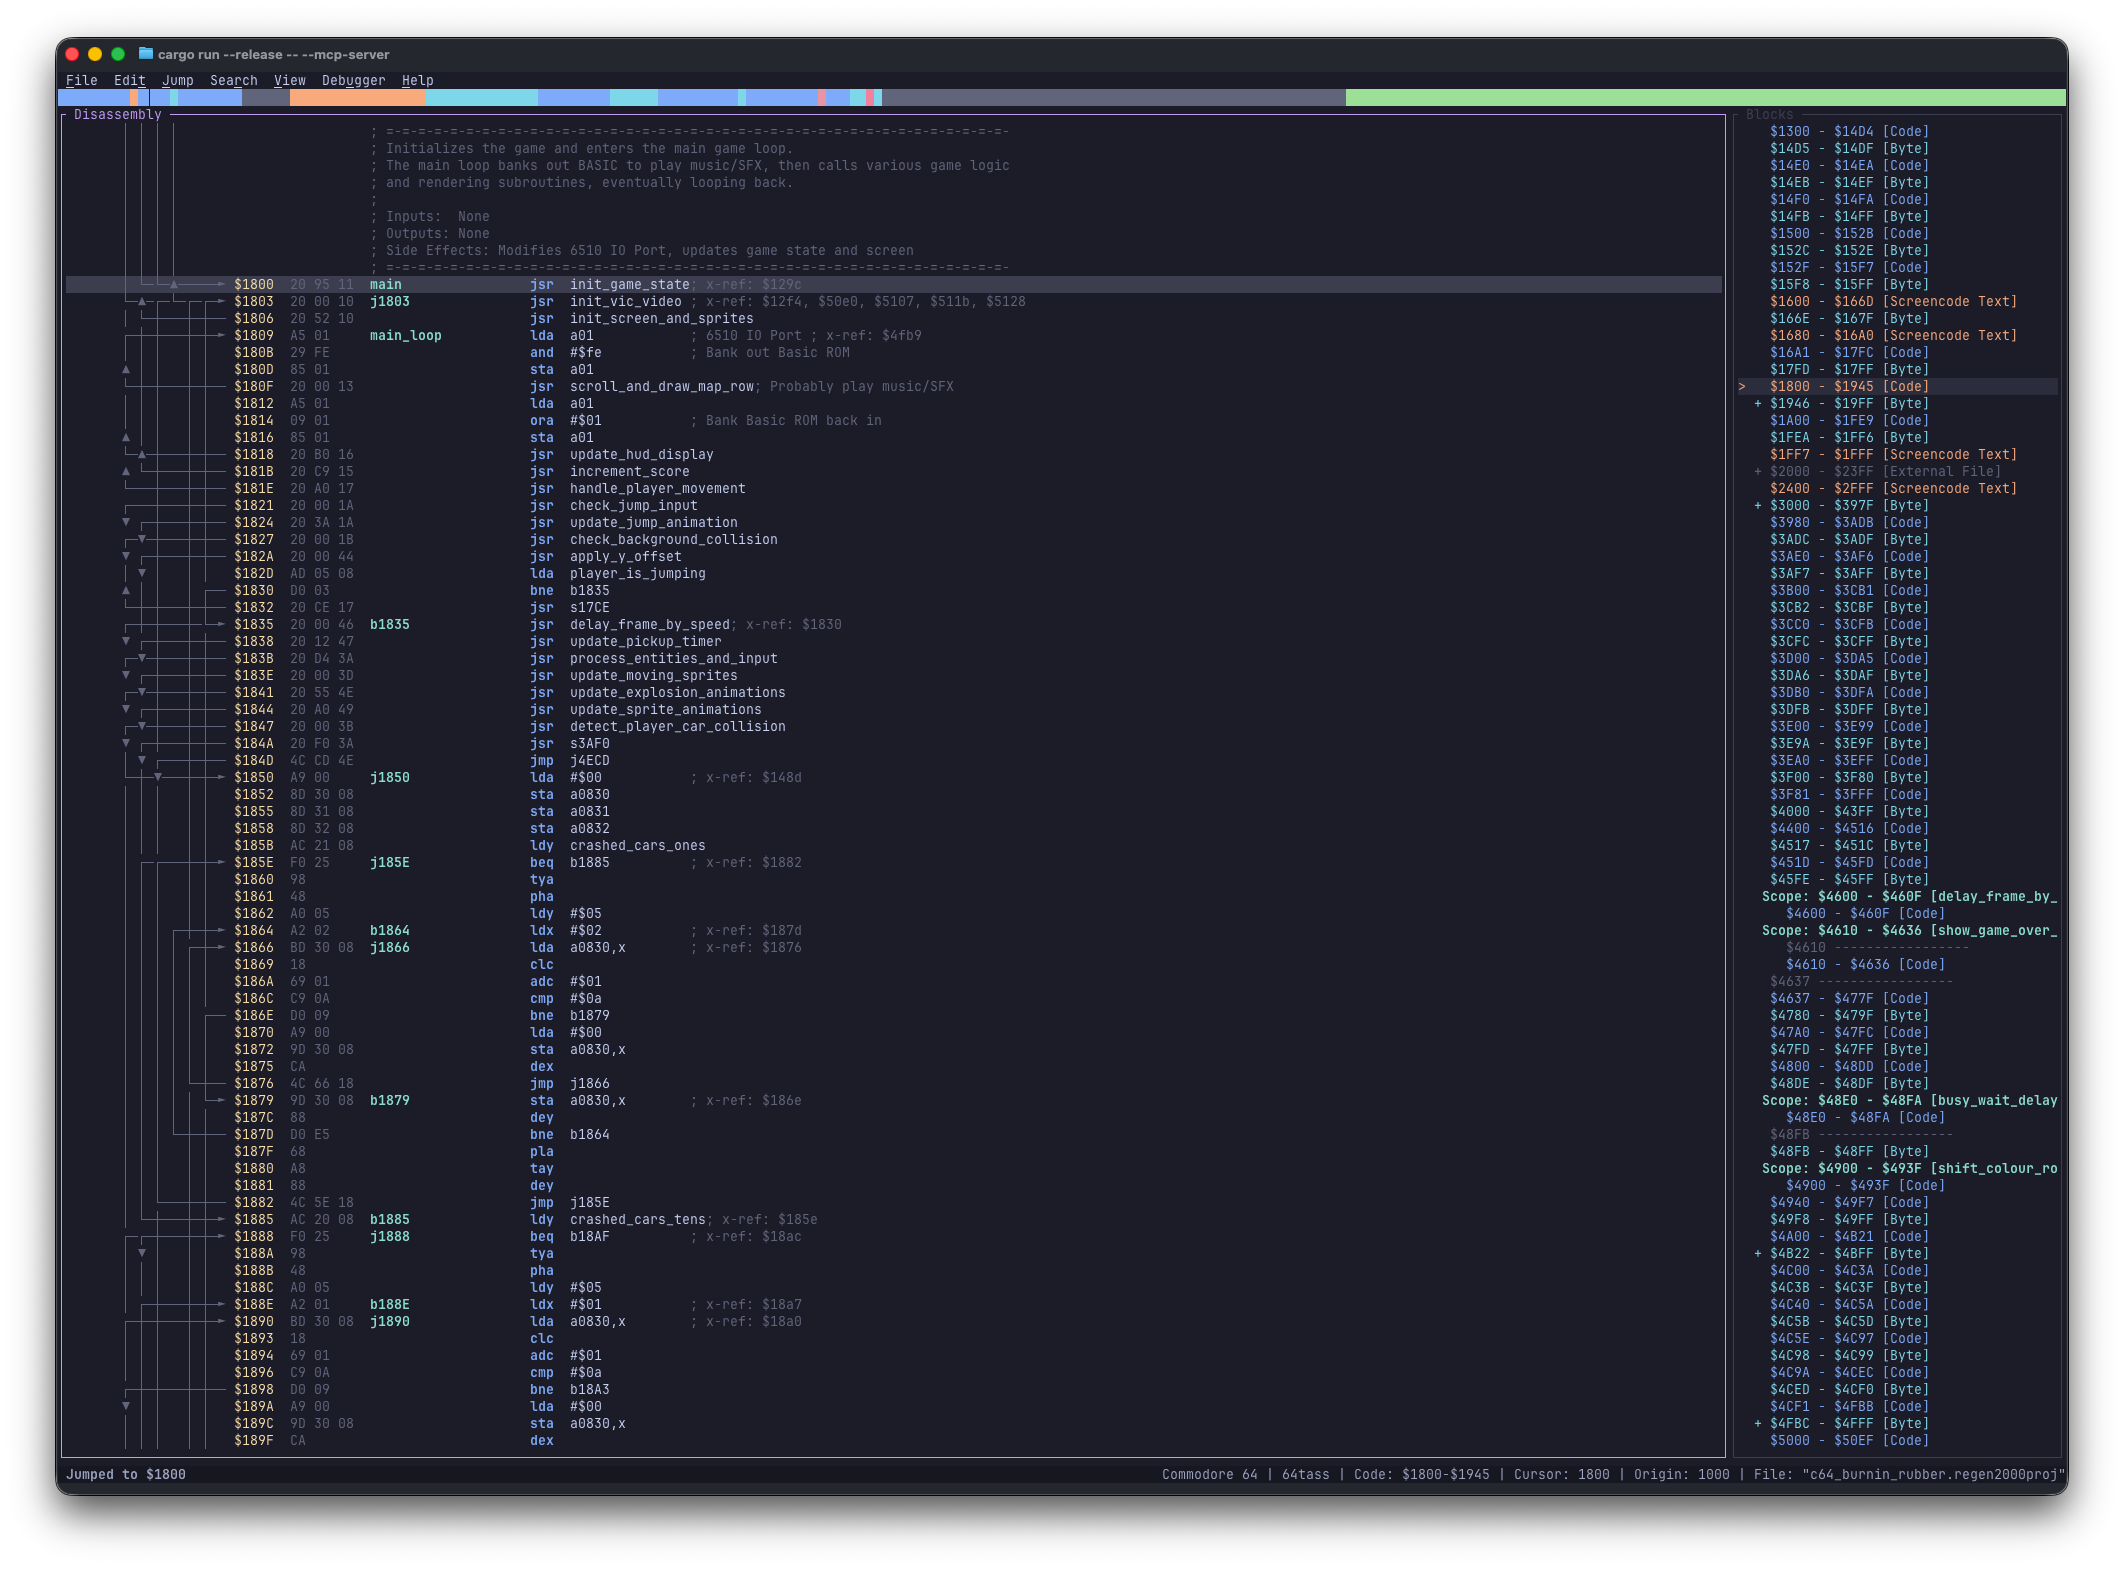
| Action | Shortcut |
|---|---|
| Toggle view | Alt+1 or Ctrl+1 |
| Toggle Collapsed Block | Ctrl+K |
| Jump to Disassembly | Enter |
Hexdump View
Press Alt+2 (or Ctrl+2) to cycle 16-byte wide → 8-byte narrow → hidden. Bytes use a value-based color palette (inspired by Color-code your bytes) alongside live PETSCII or Screencode text decoding (M / Shift+M).
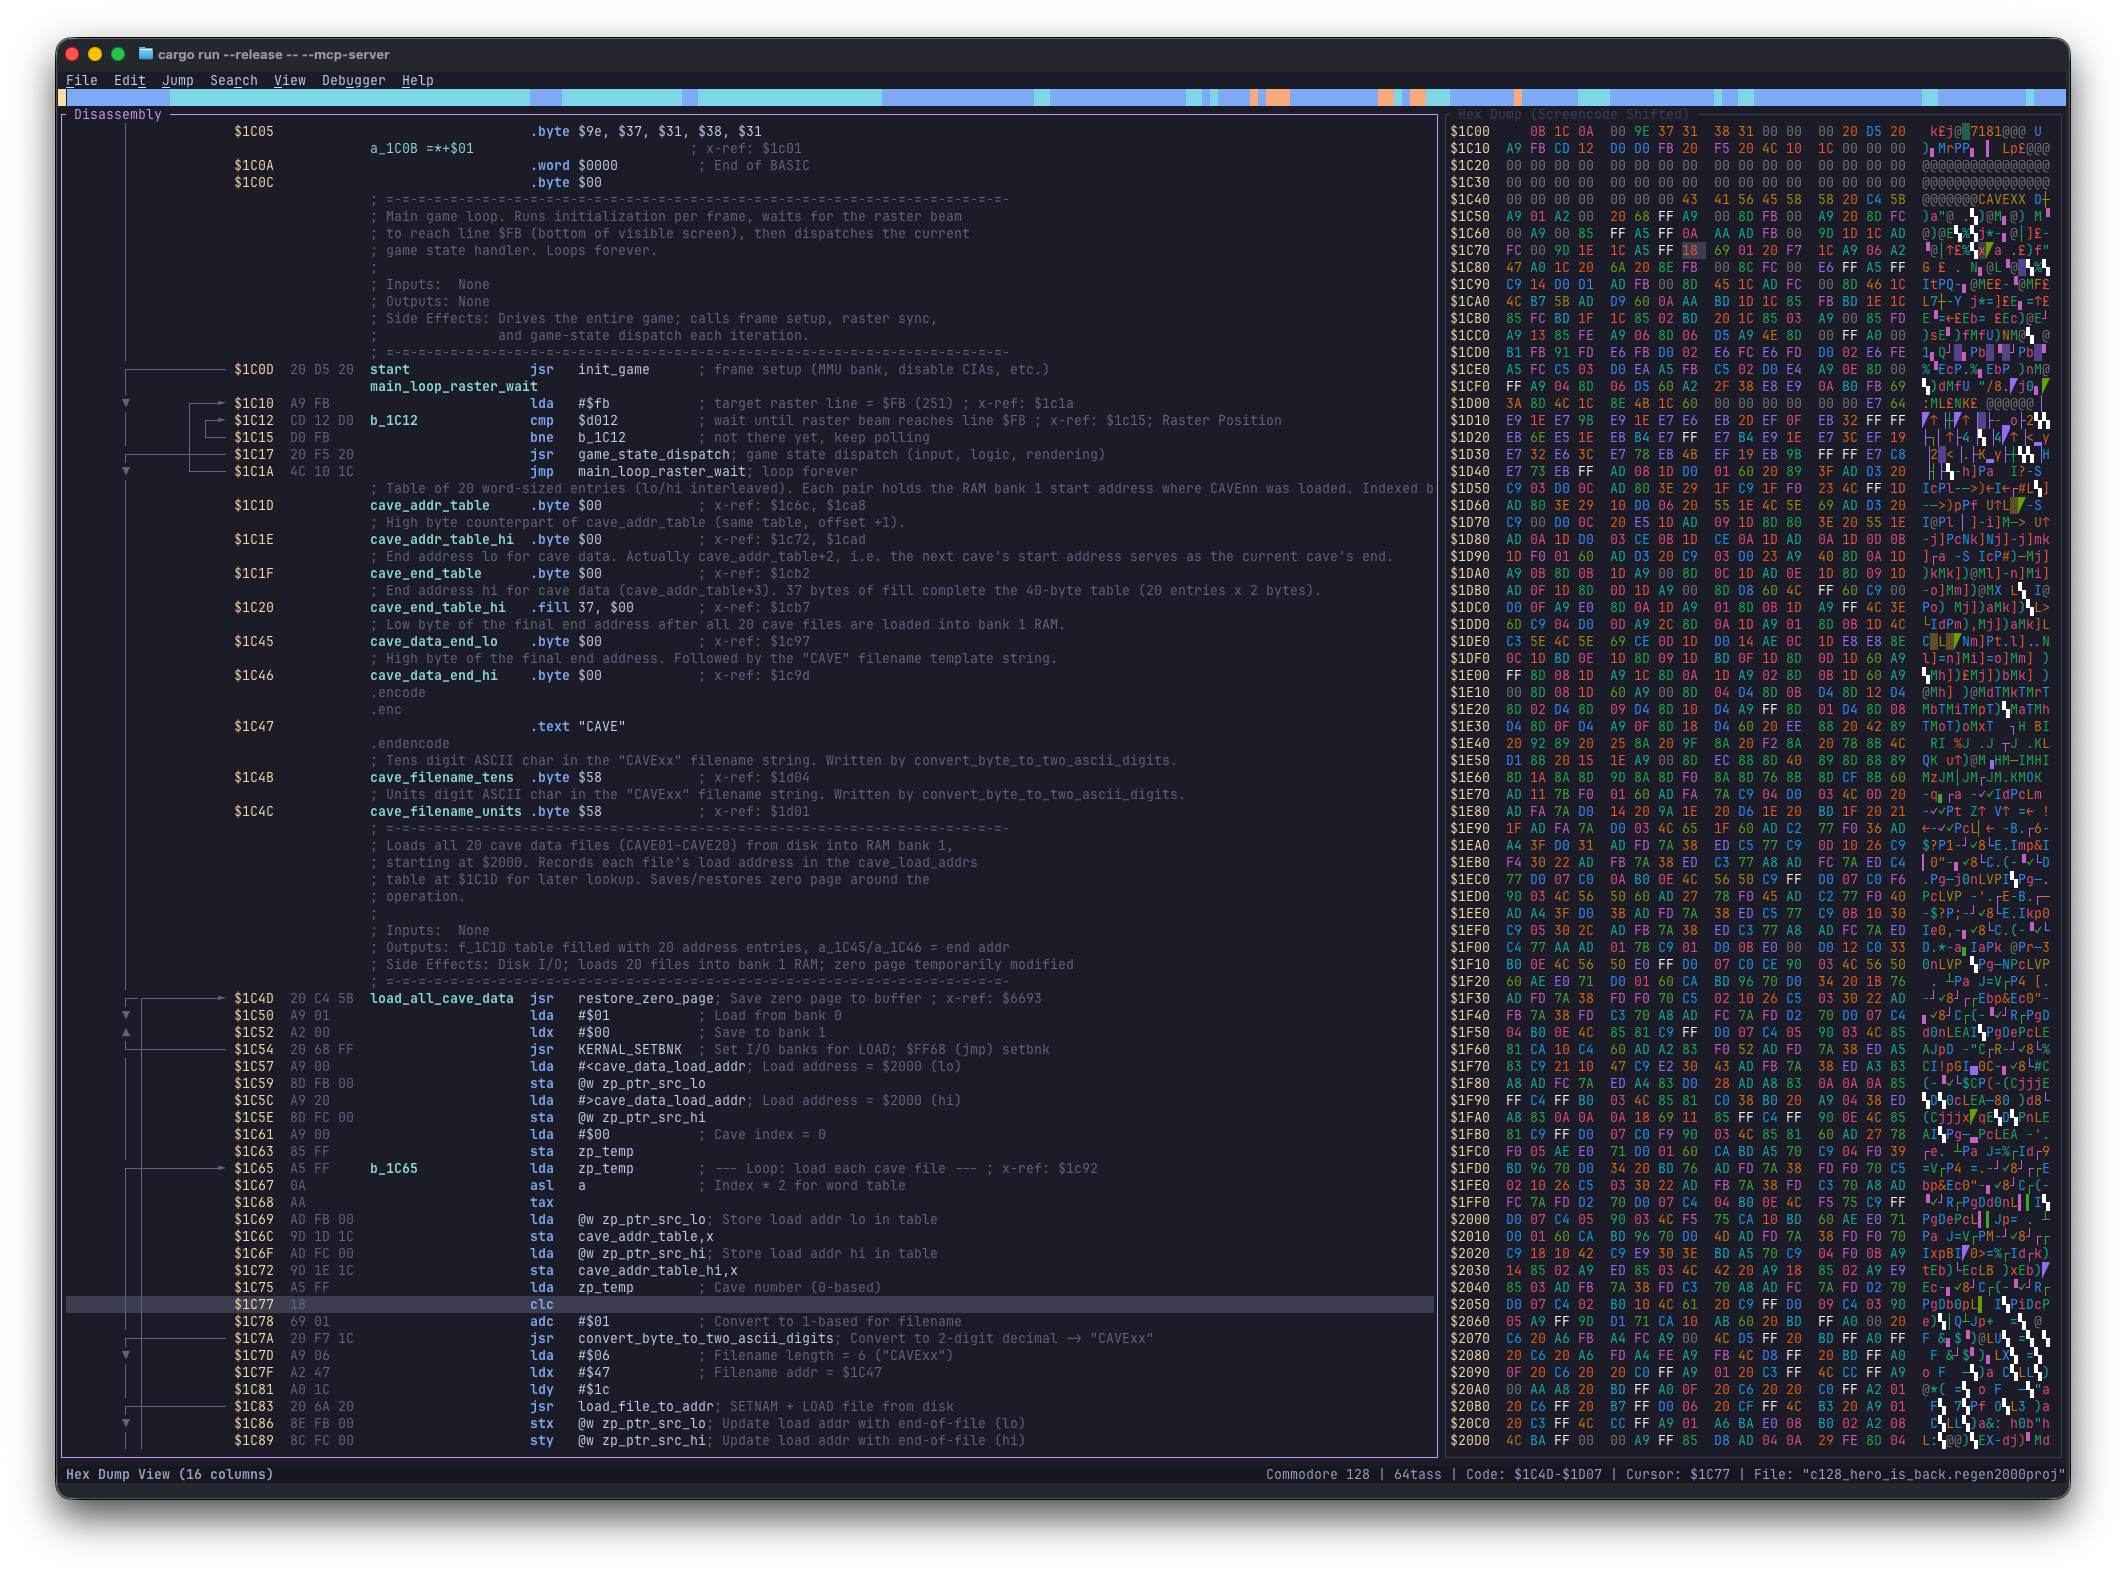
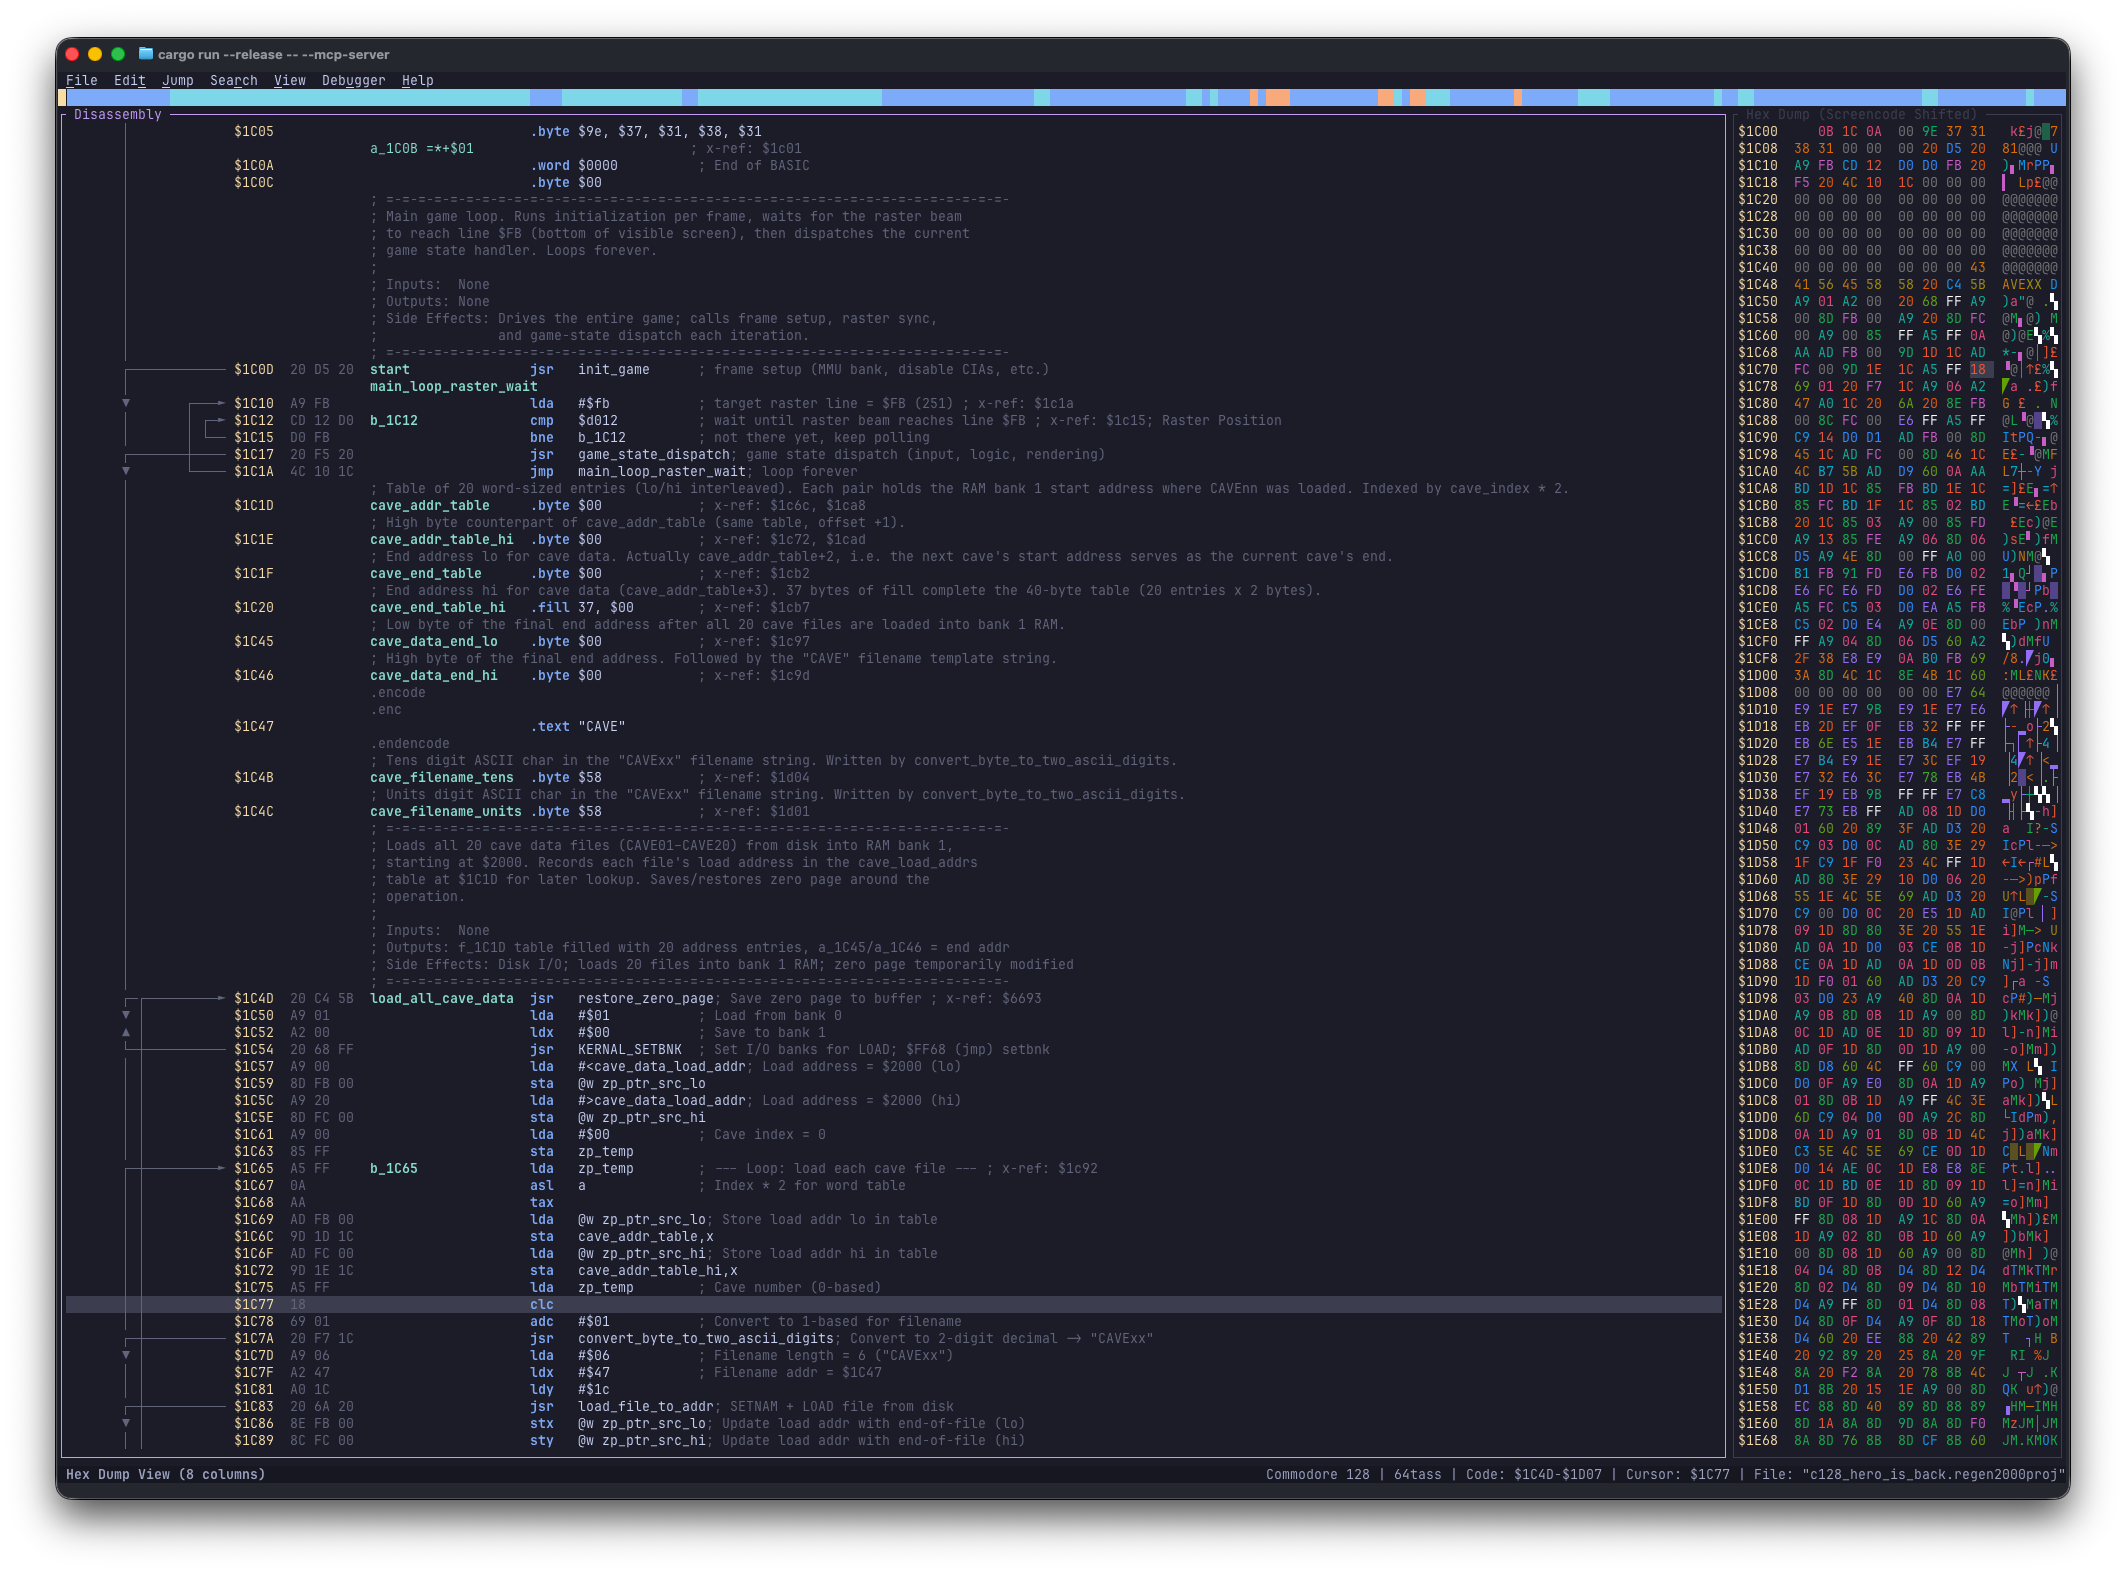
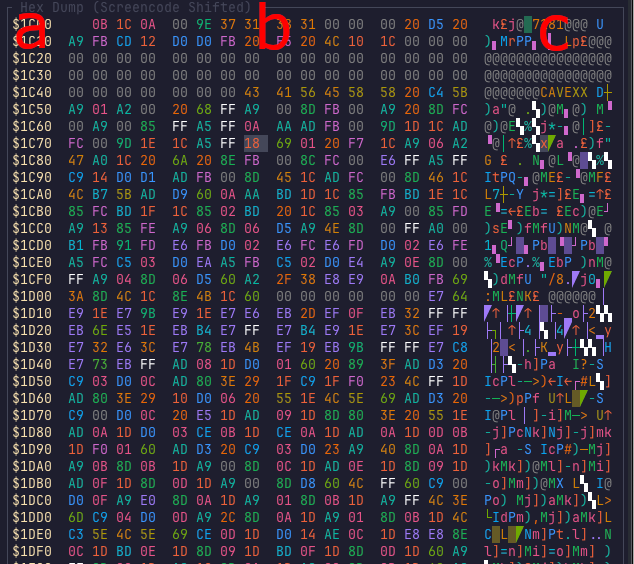
Hexdump columns: a row address · b 8/16 raw hex bytes · c Screencode/PETSCII text preview.
| Action | Shortcut |
|---|---|
| Cycle view (16-byte, 8-byte, hidden) | Alt+2 or Ctrl+2 |
| Column Navigation | Left / Right / H / L |
| Toggle Visual Mode | Shift+V |
| Select Bytes | Shift+Up / Shift+Down / Shift+Left / Shift+Right |
| Clear Selection | Esc |
| Convert to Byte | B |
| Next / Prev Text Mode (Screencode / PETSCII) | M / Shift+M |
| Jump to Disassembly | Enter |
Sprites View
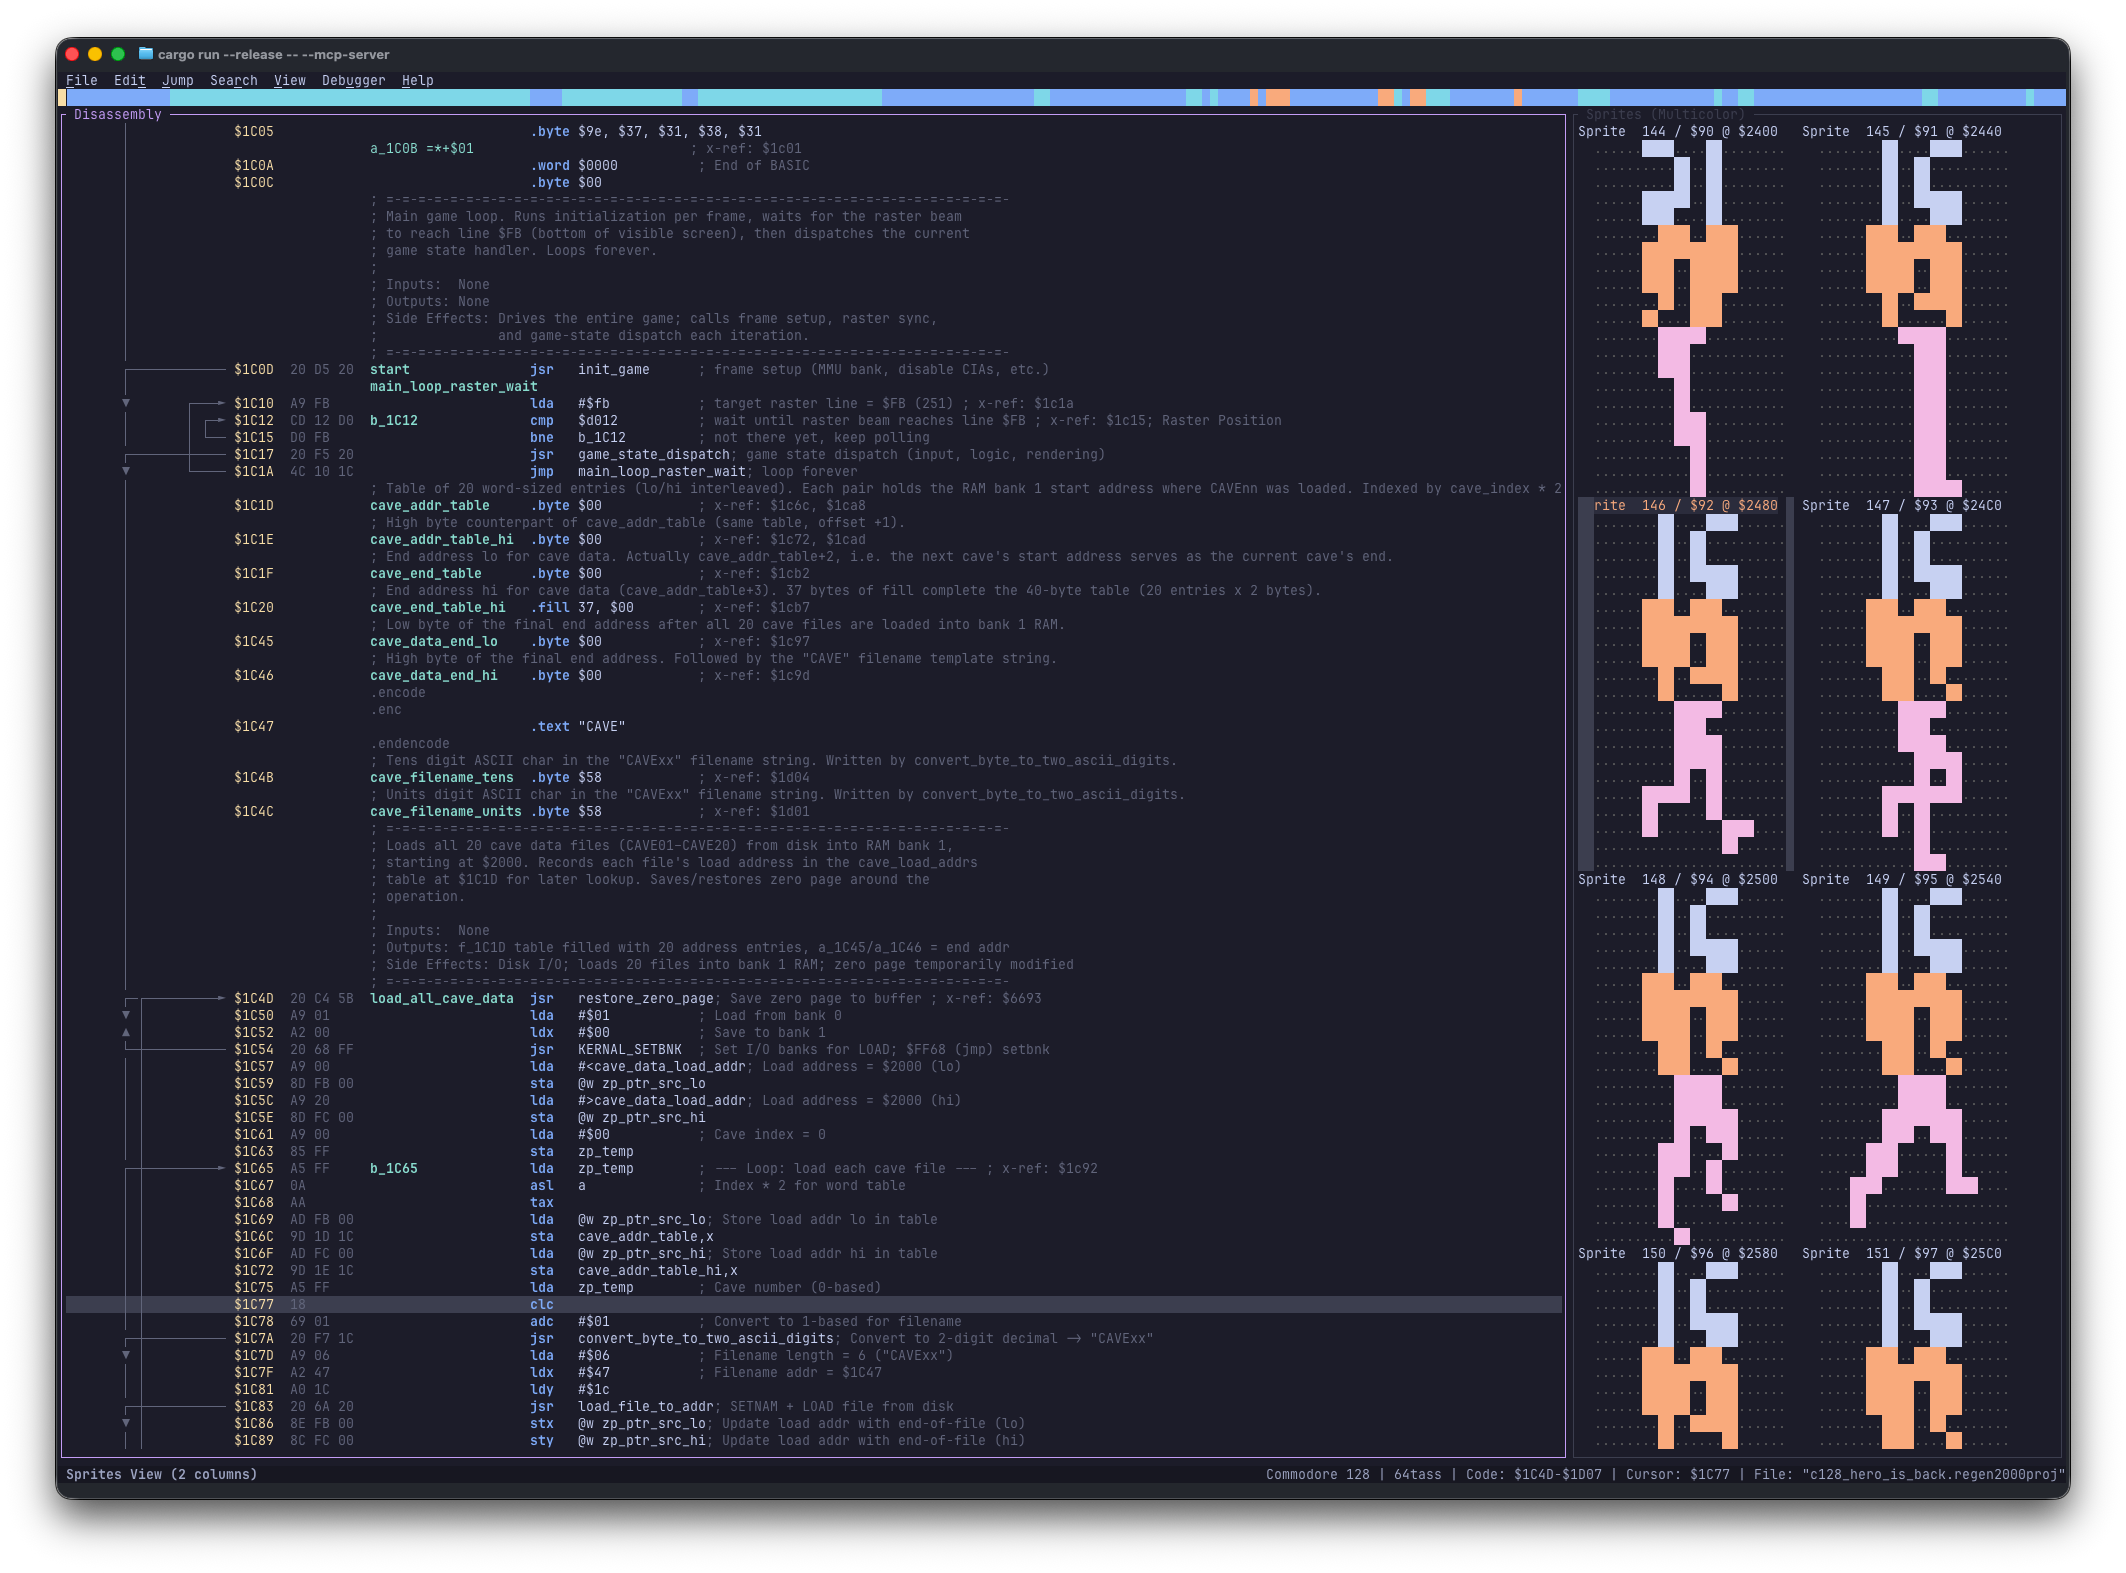
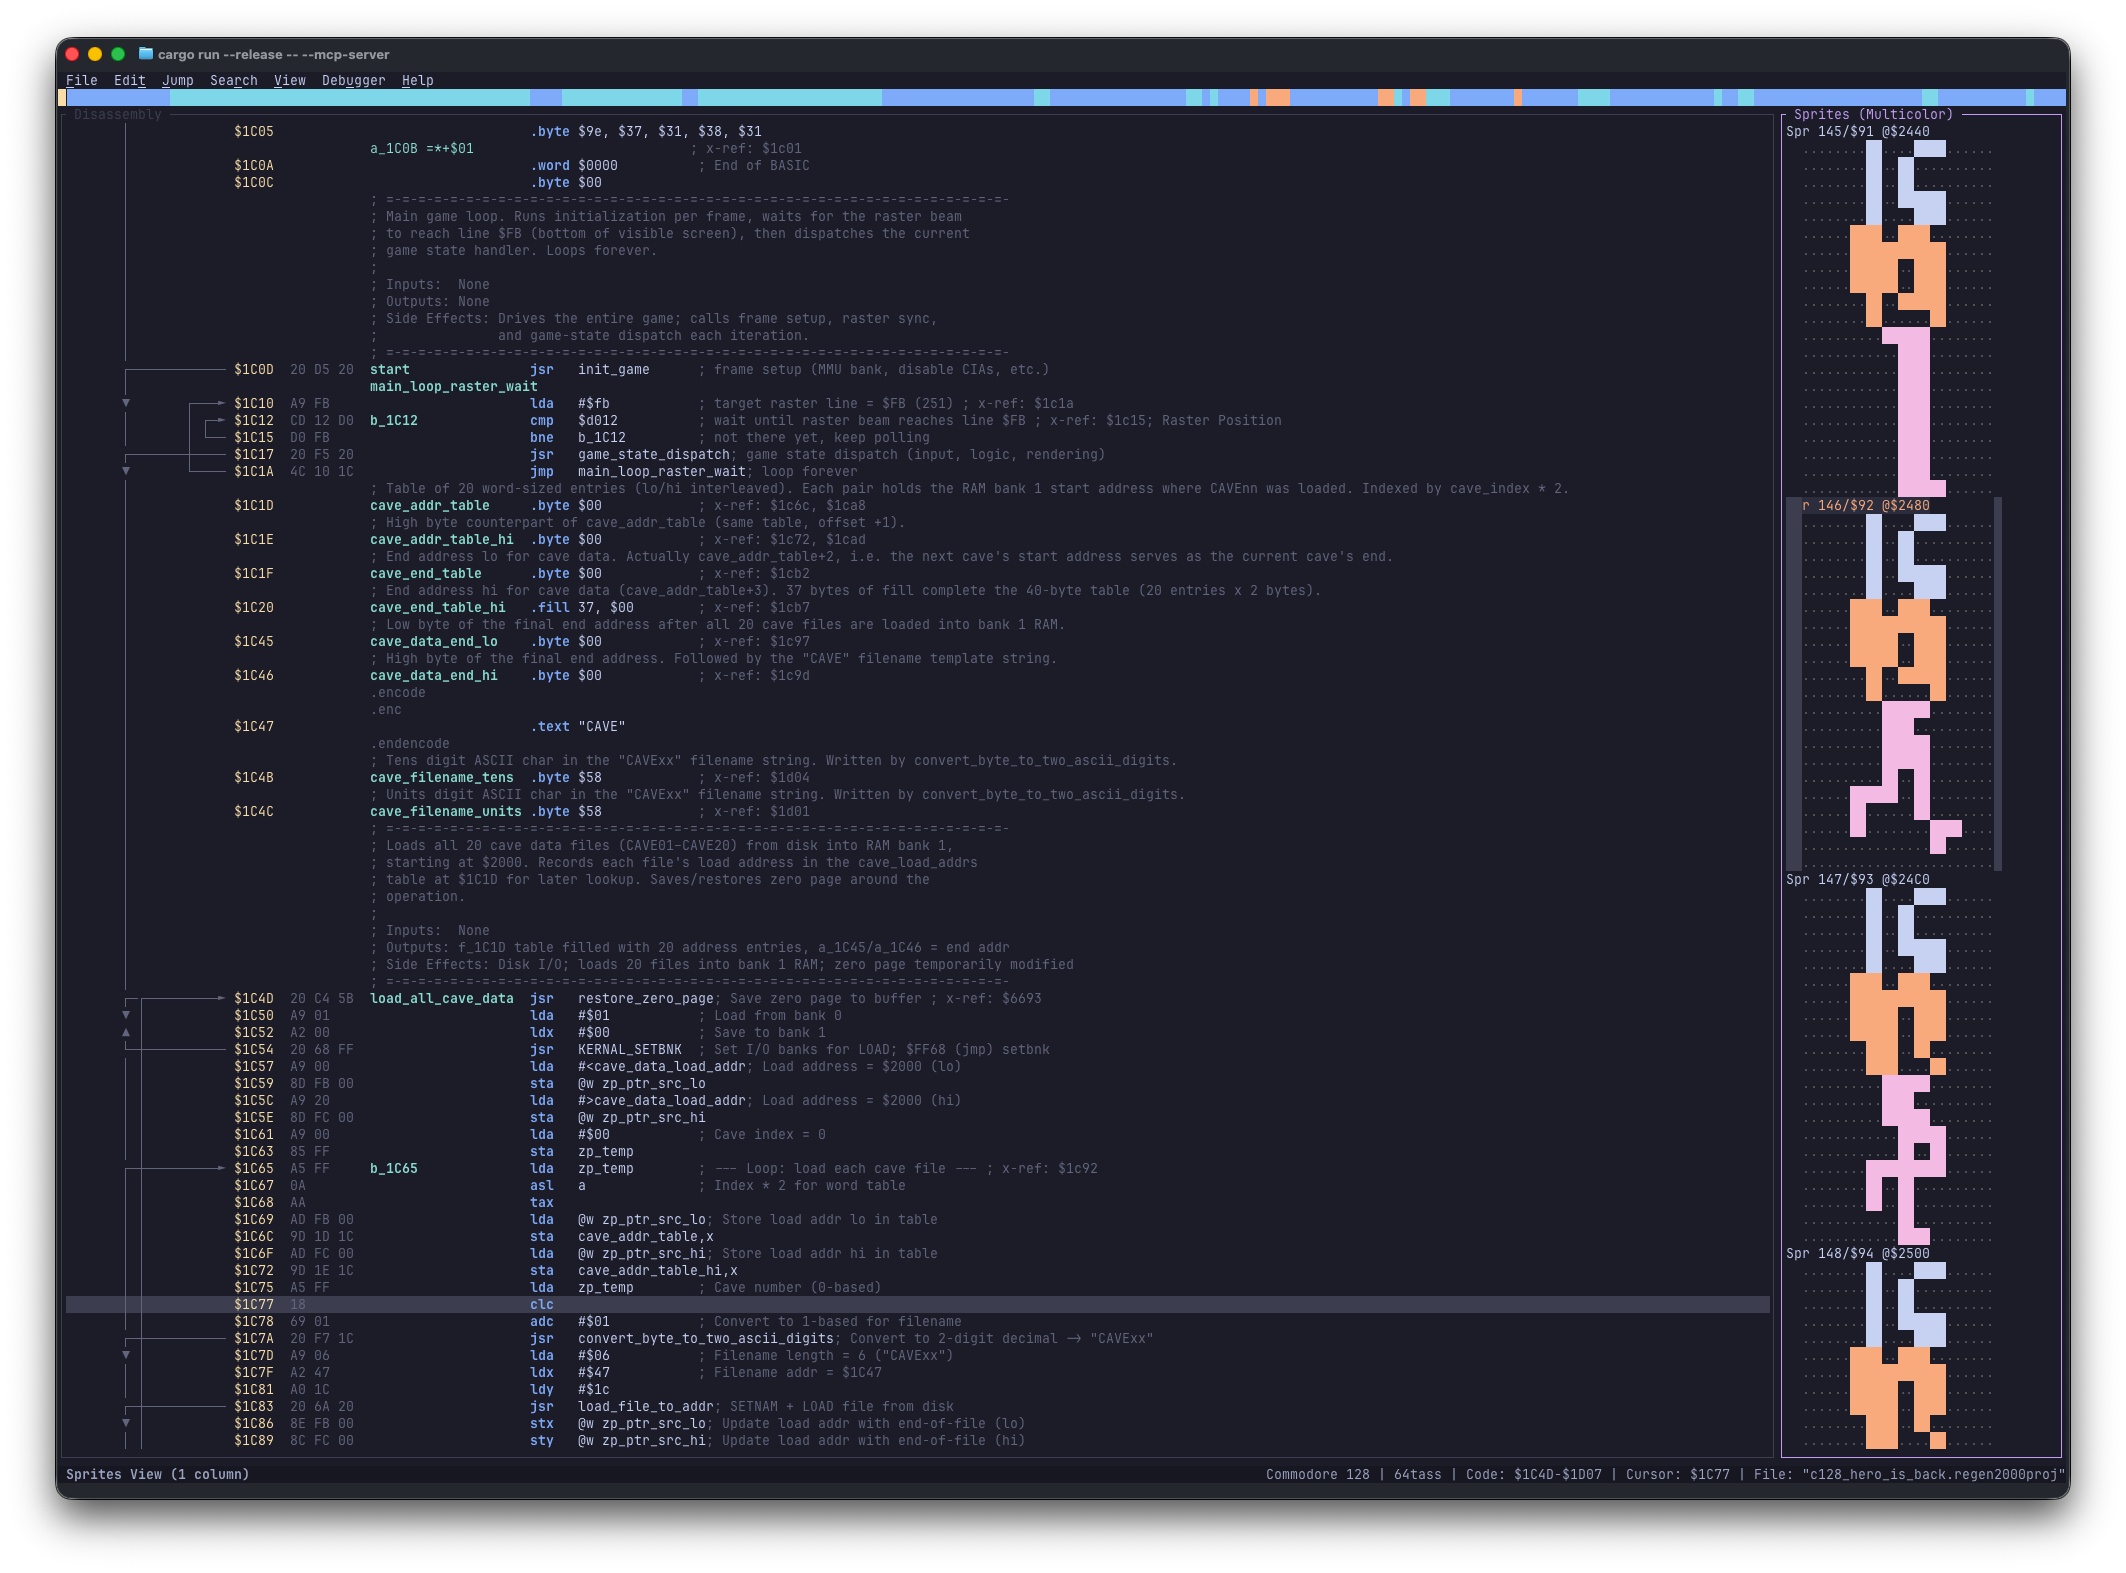
Press Alt+3 (or Ctrl+3) to cycle 2-sprites wide → 1-sprite narrow → hidden. Renders 64-byte chunks as 24×21 hardware sprites in single-color or multicolor mode (M).
| Action | Shortcut |
|---|---|
| Cycle view (2-sprites, 1-sprite, hidden) | Alt+3 or Ctrl+3 |
| Column Navigation (2-sprites mode) | Left / Right / H / L |
| Toggle Visual Mode | Shift+V |
| Select Sprites | Shift+Up / Shift+Down / Shift+Left / Shift+Right |
| Clear Selection | Esc |
| Convert to Byte | B |
| Toggle Multicolor | M |
| Jump to Disassembly | Enter |
Charset View
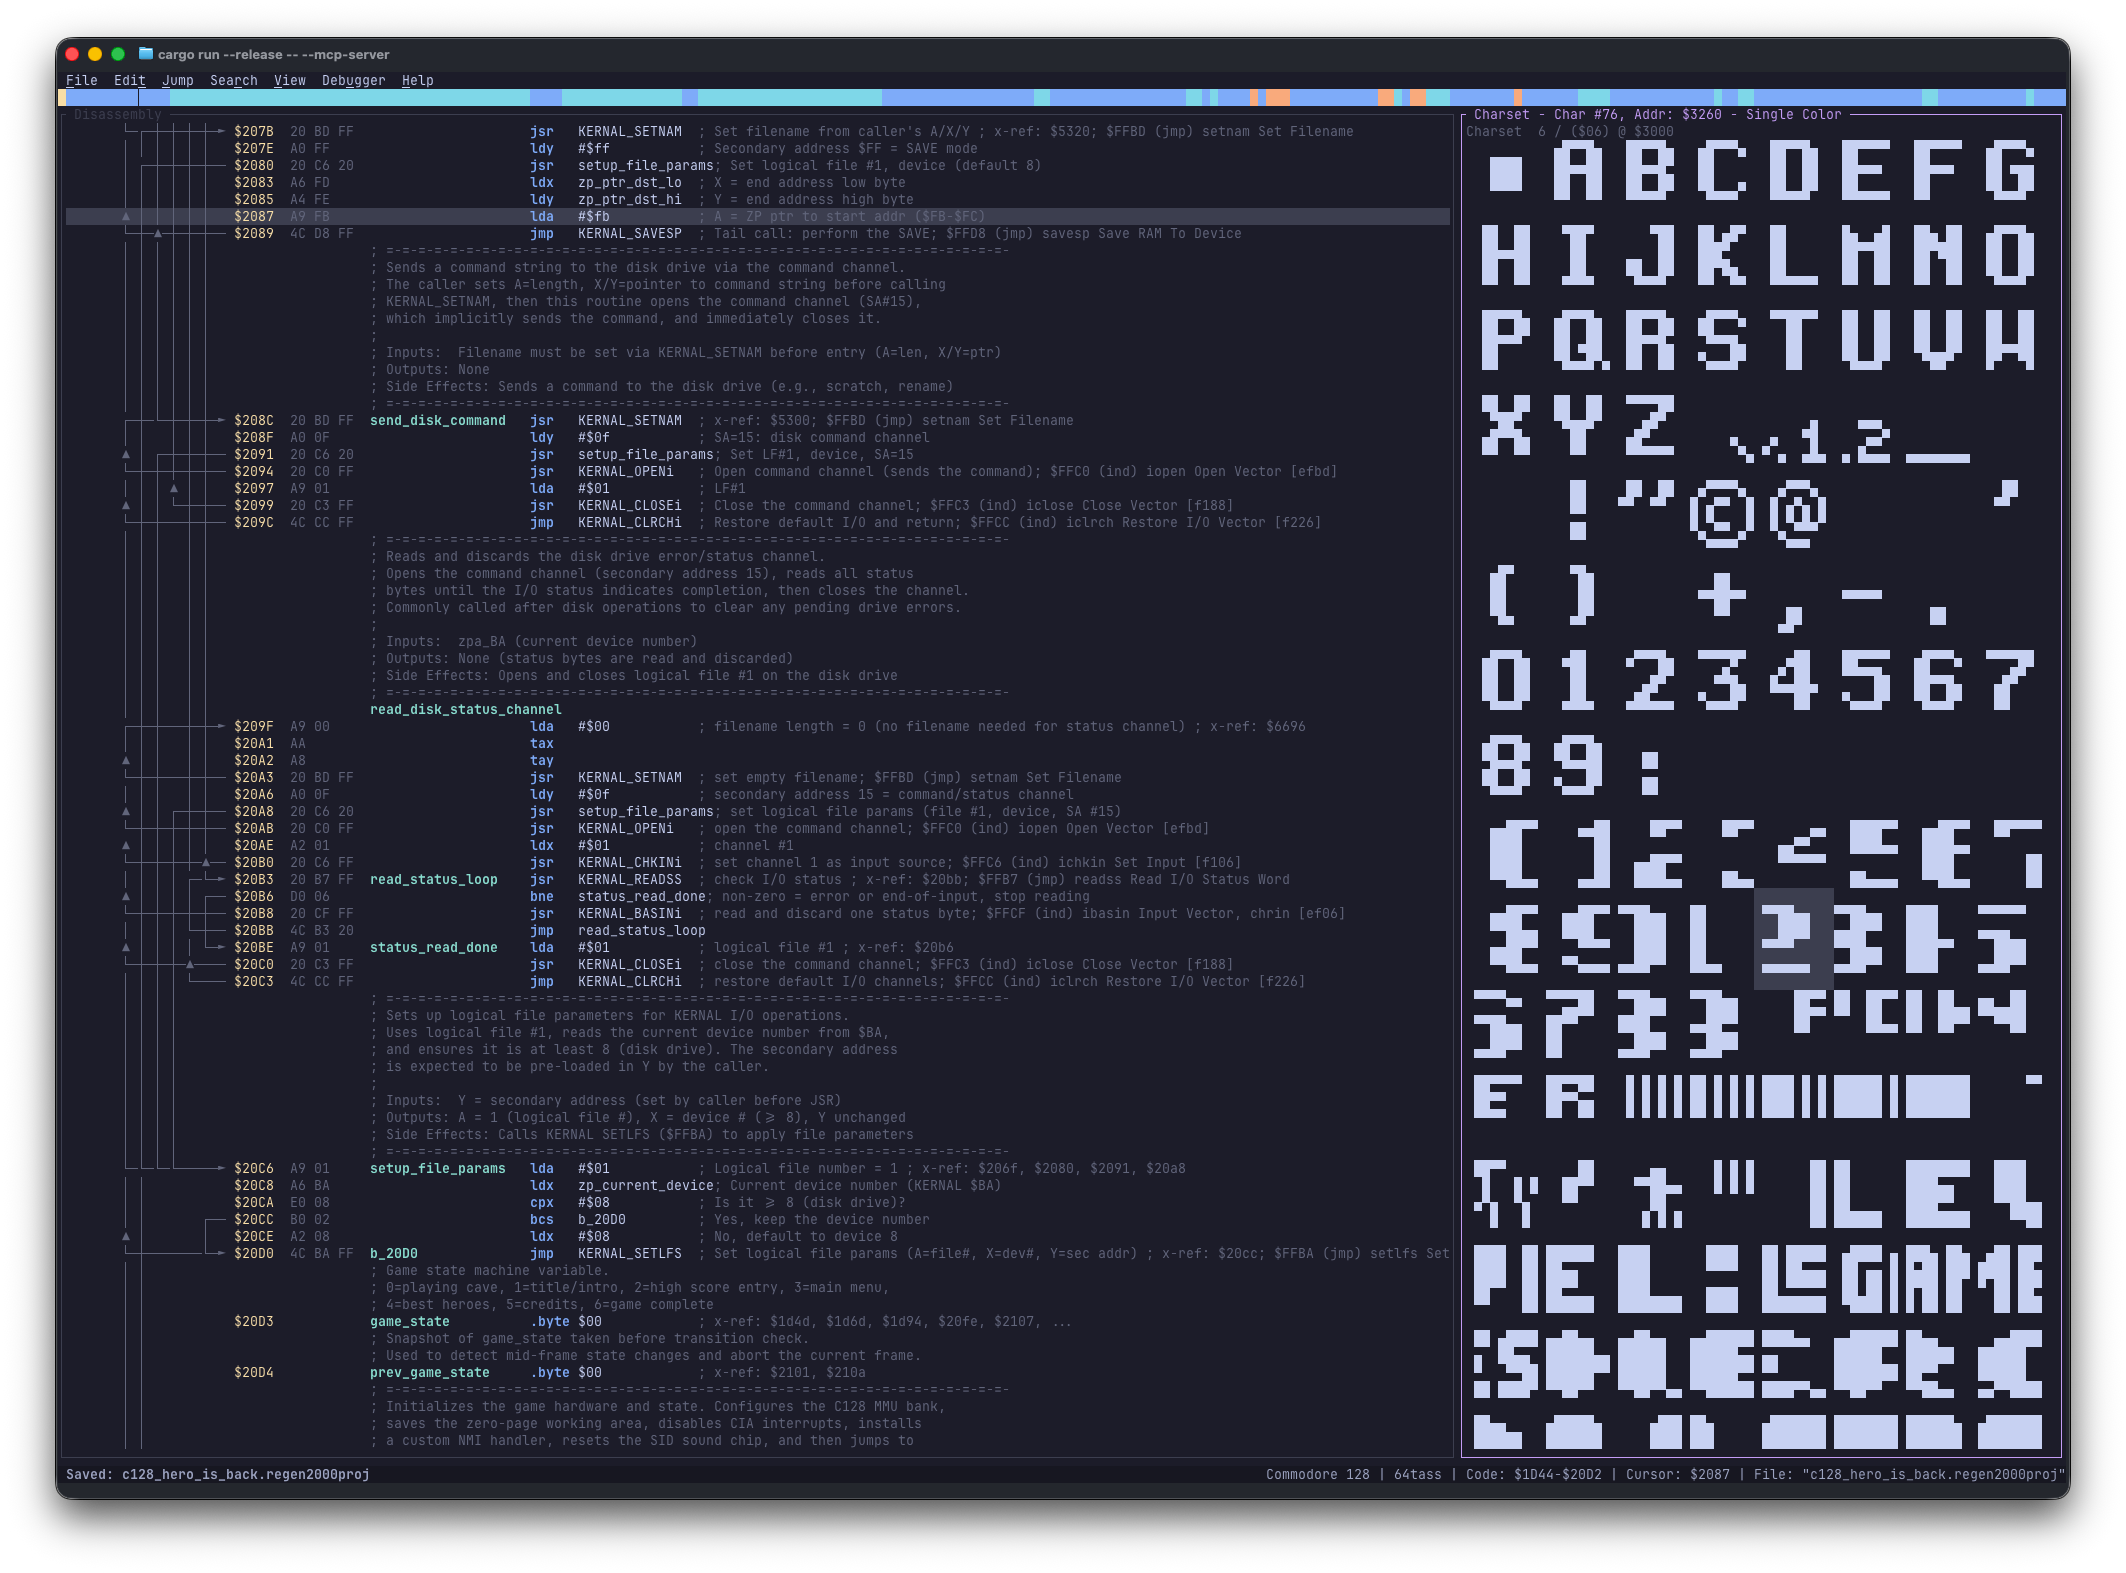
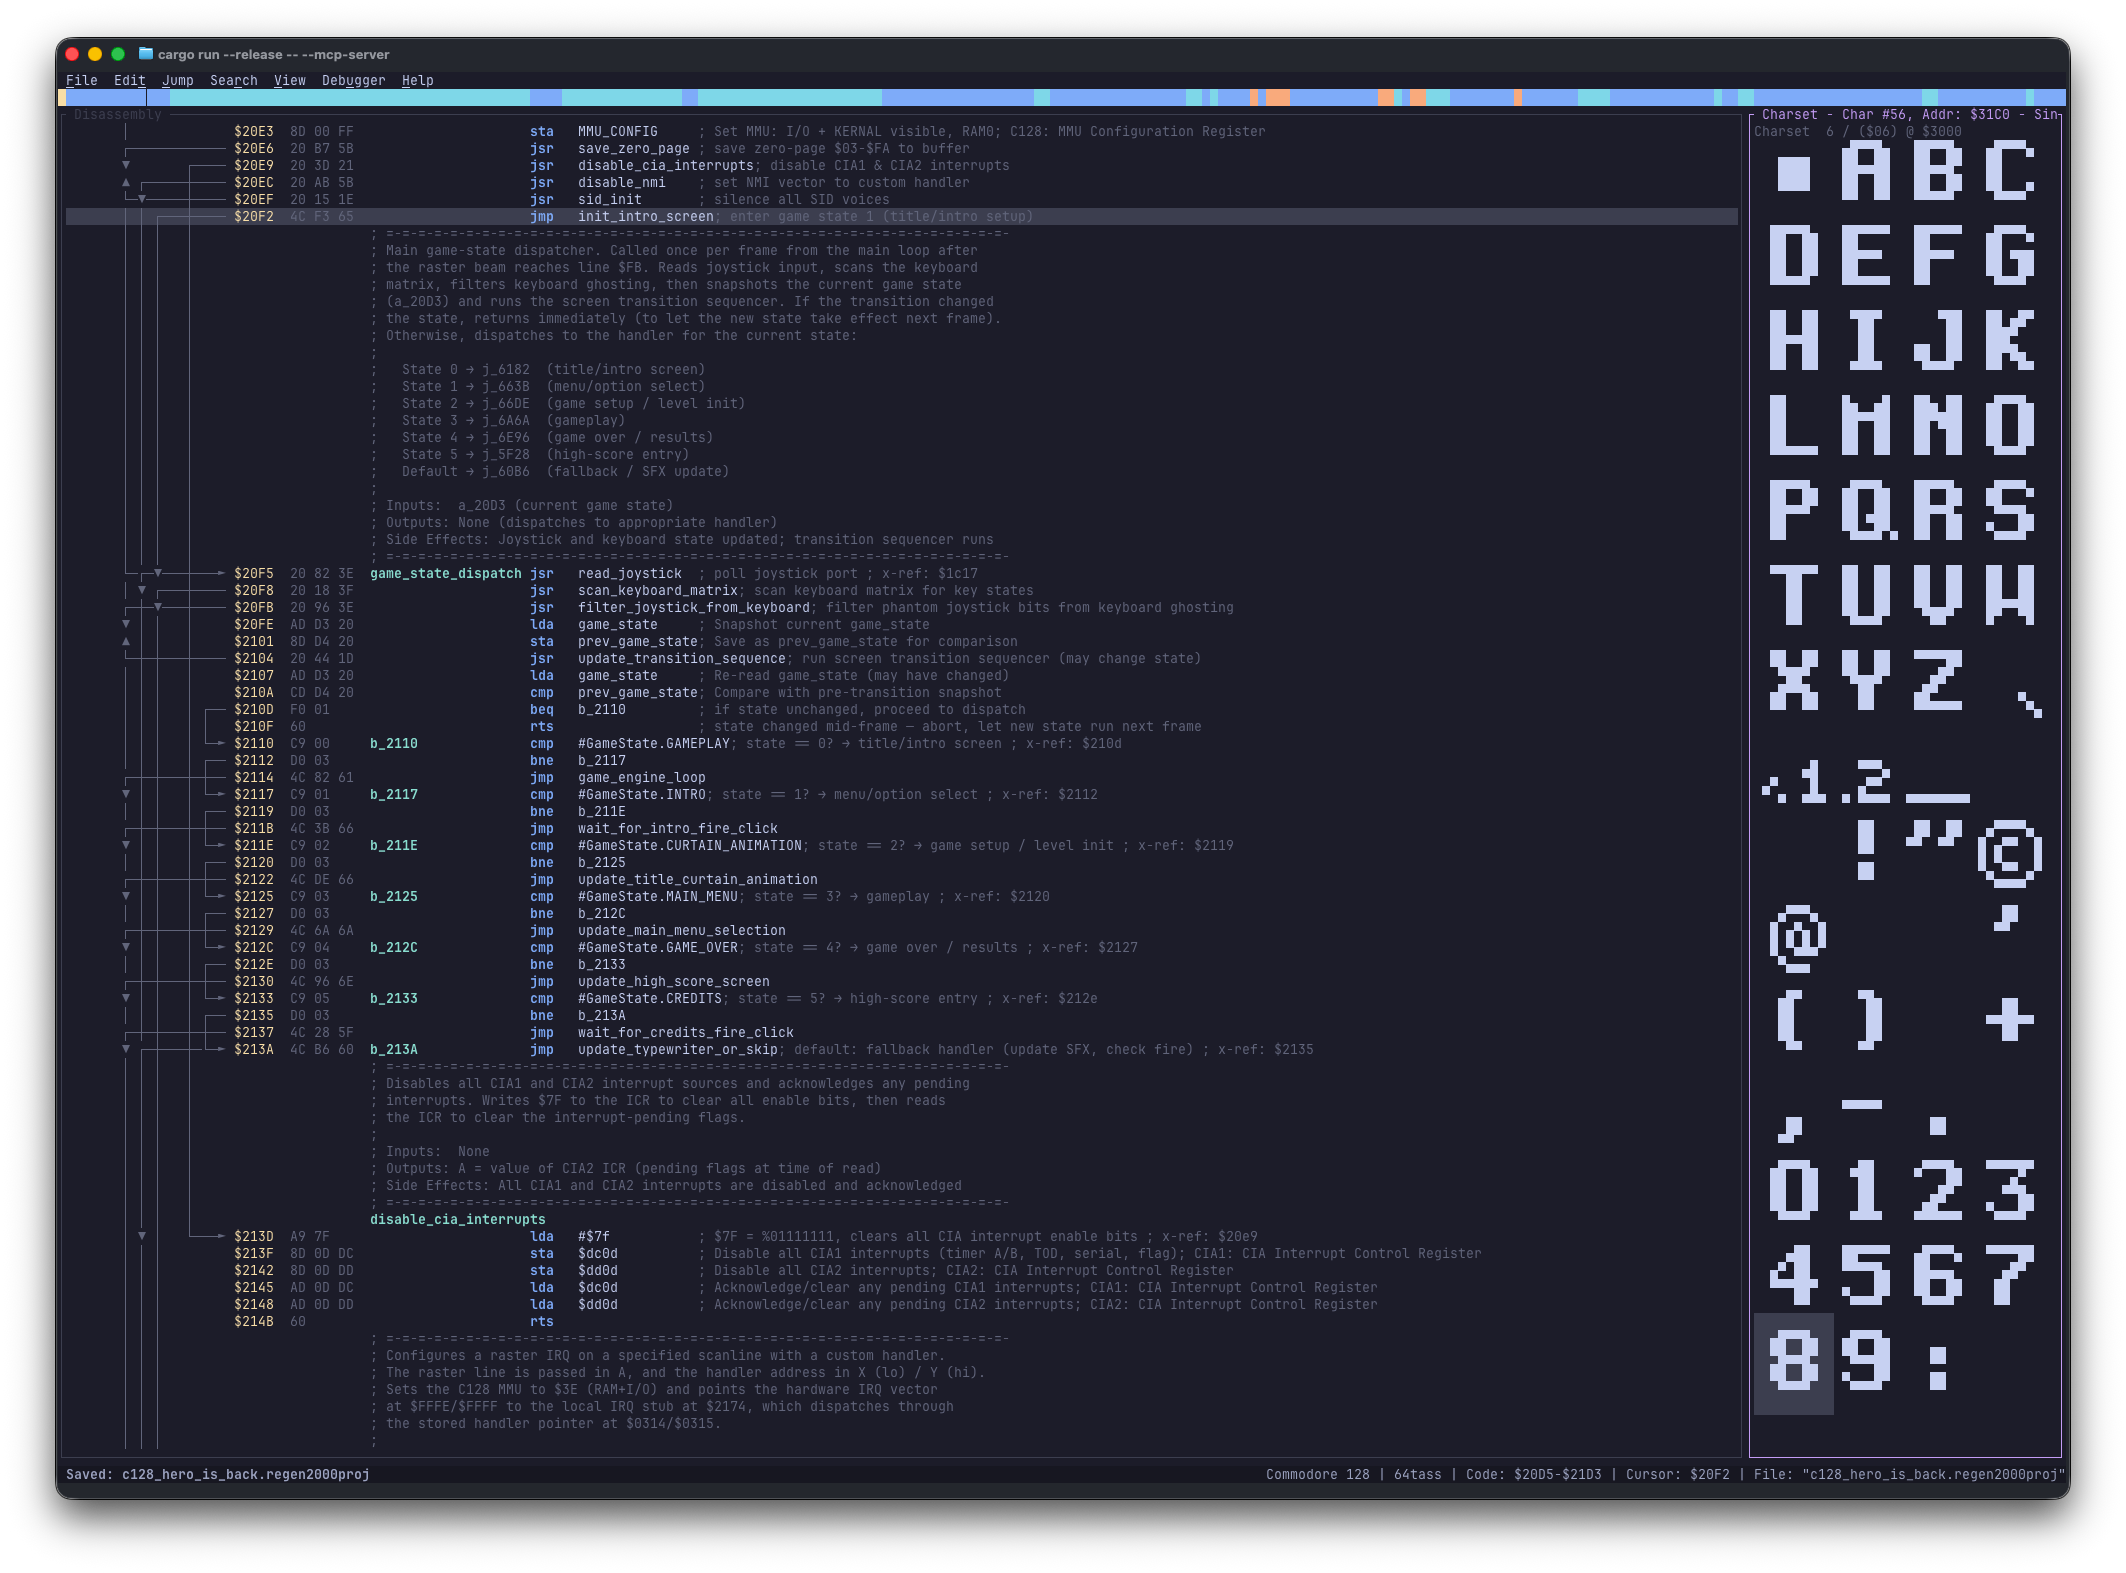
Press Alt+4 (or Ctrl+4) to cycle 8-chars wide → 4-chars narrow → hidden. Renders memory as 8×8 character tiles in high-resolution or multicolor mode (M) to spot custom fonts.
| Action | Shortcut |
|---|---|
| Cycle view (8-chars, 4-chars, hidden) | Alt+4 or Ctrl+4 |
| Column Navigation | Left / Right / H / L |
| Toggle Visual Mode | Shift+V |
| Select Characters | Shift+Up / Shift+Down / Shift+Left / Shift+Right |
| Clear Selection | Esc |
| Convert to Byte | B |
| Toggle Multicolor | M |
| Jump to Disassembly | Enter |
Bitmap View
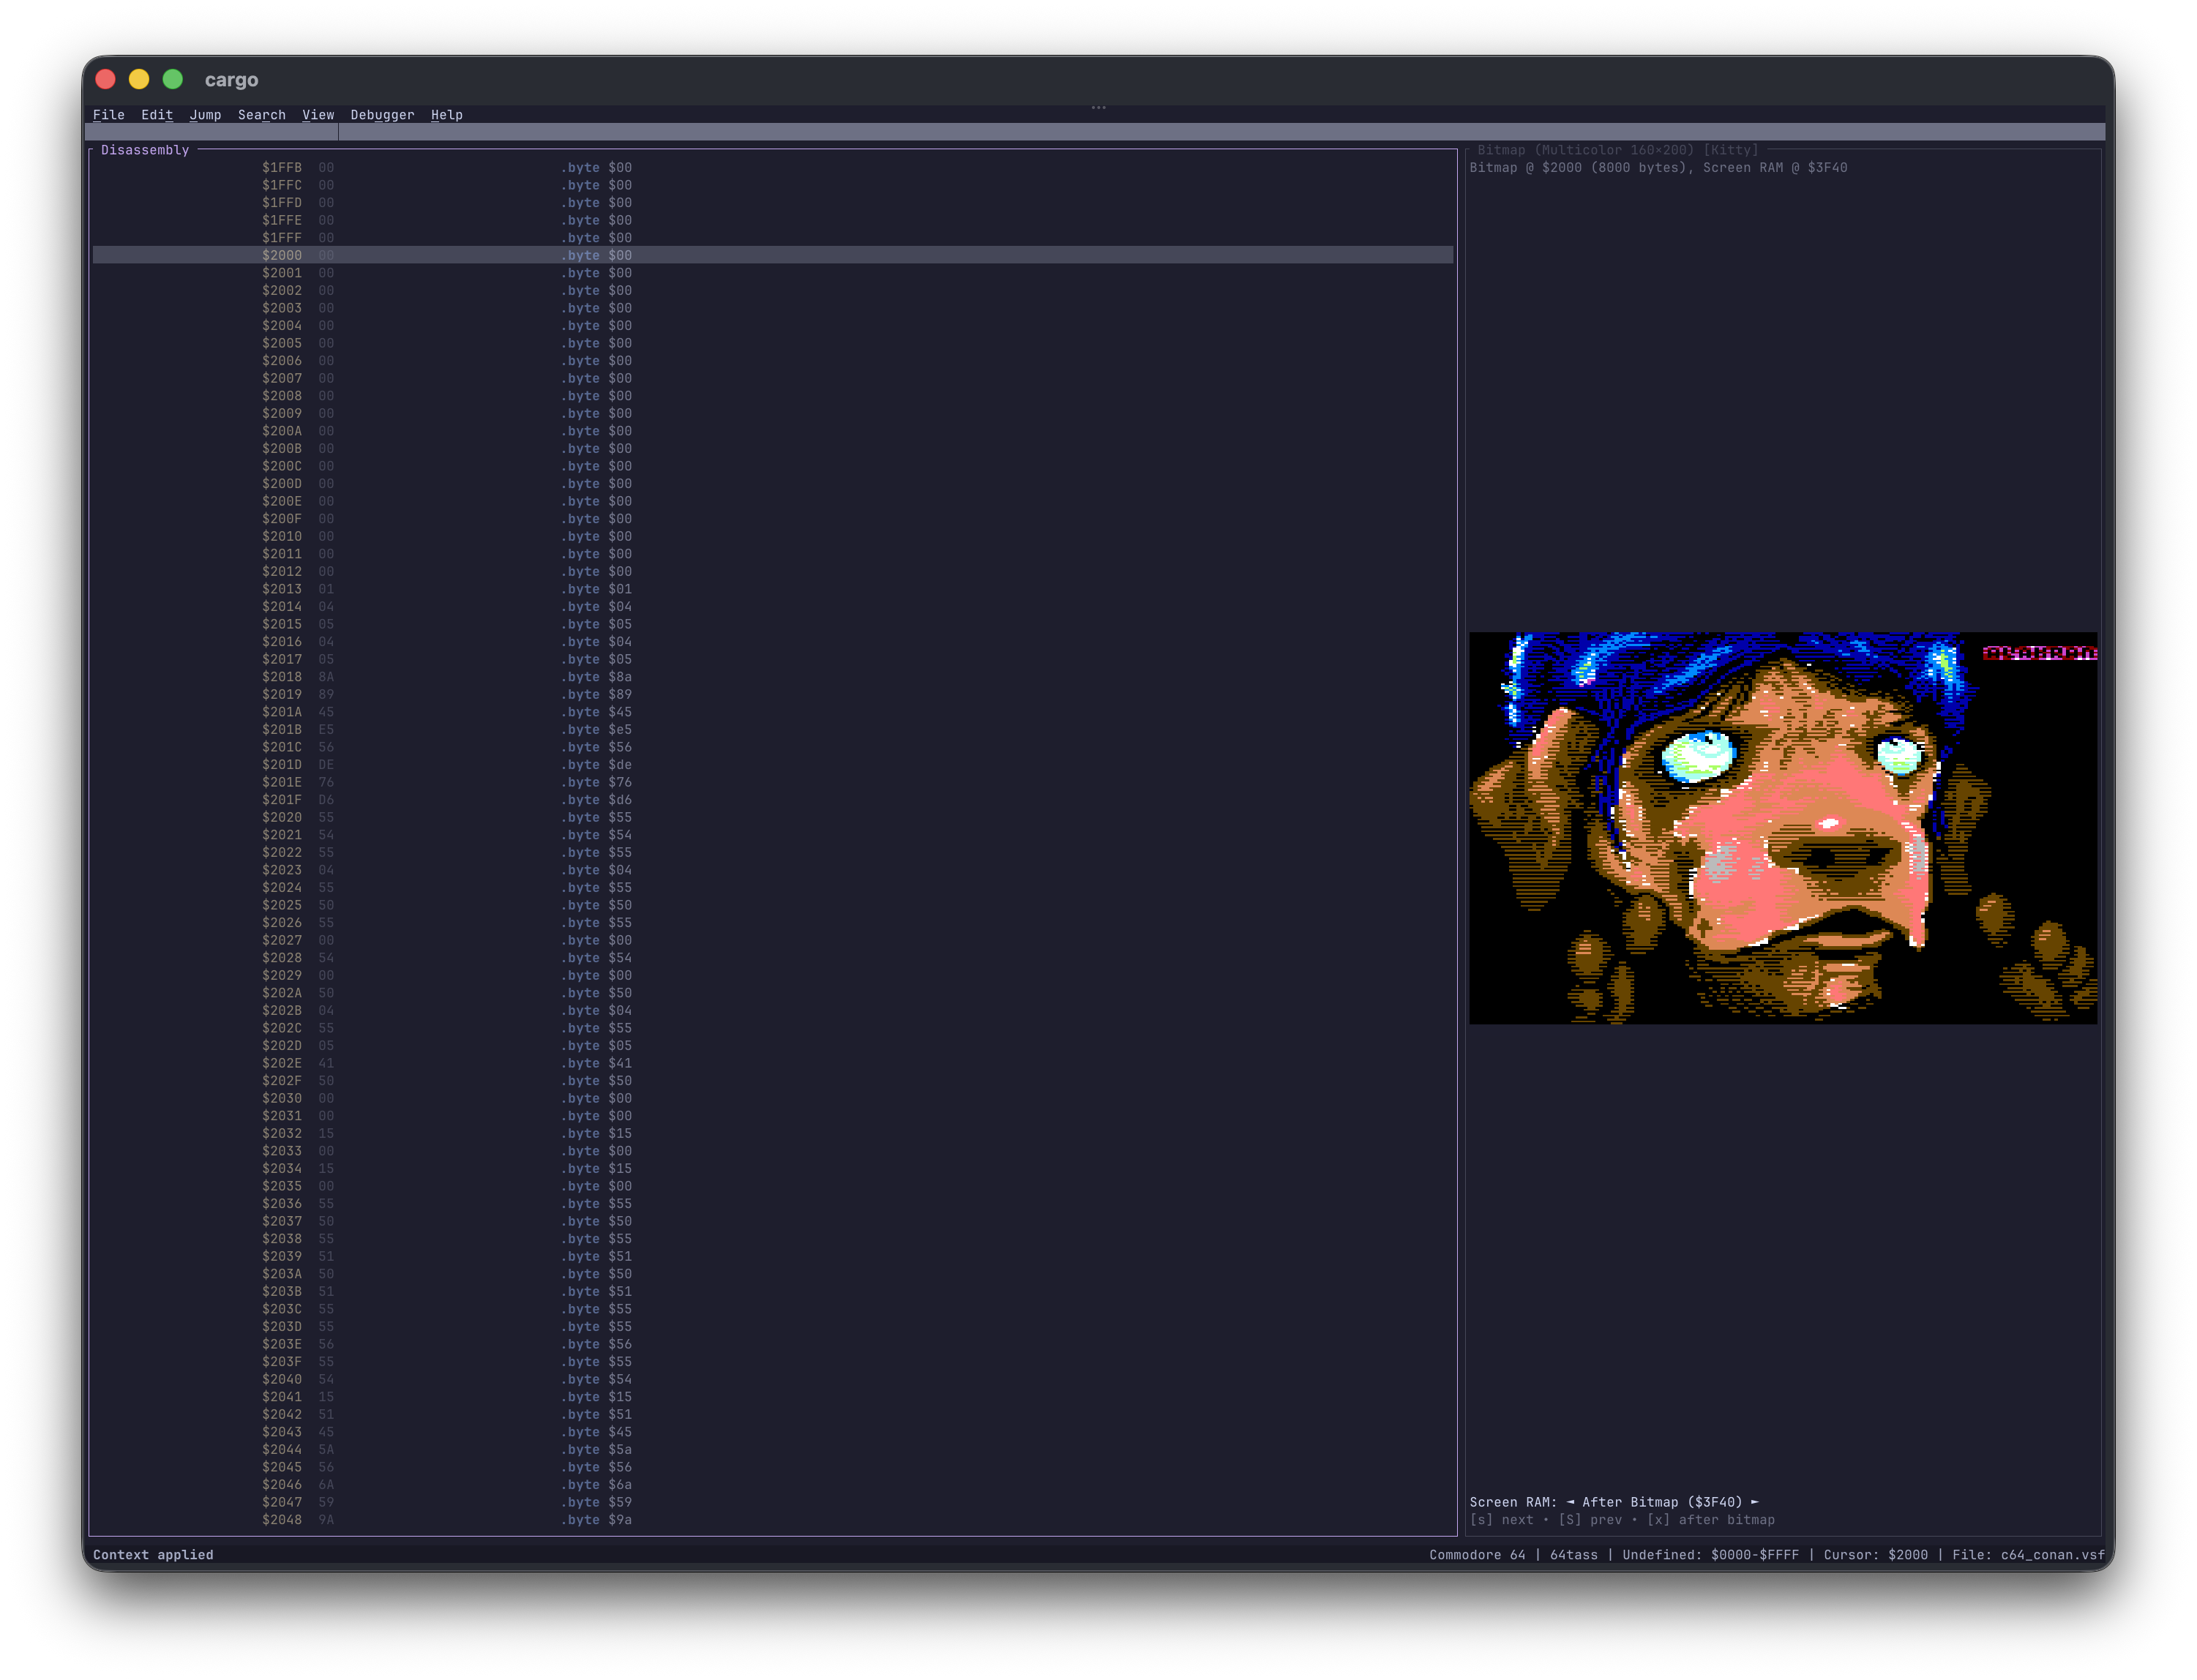
Press Alt+5 (or Ctrl+5) to toggle full-screen 320×200 / 160×200 bitmap rendering.
Automatic Pixel Graphics Detection
Regenerator 2000 detects Kitty, iTerm2, and Sixel terminal protocols at startup and falls back cleanly to Unicode halfblocks when unsupported.
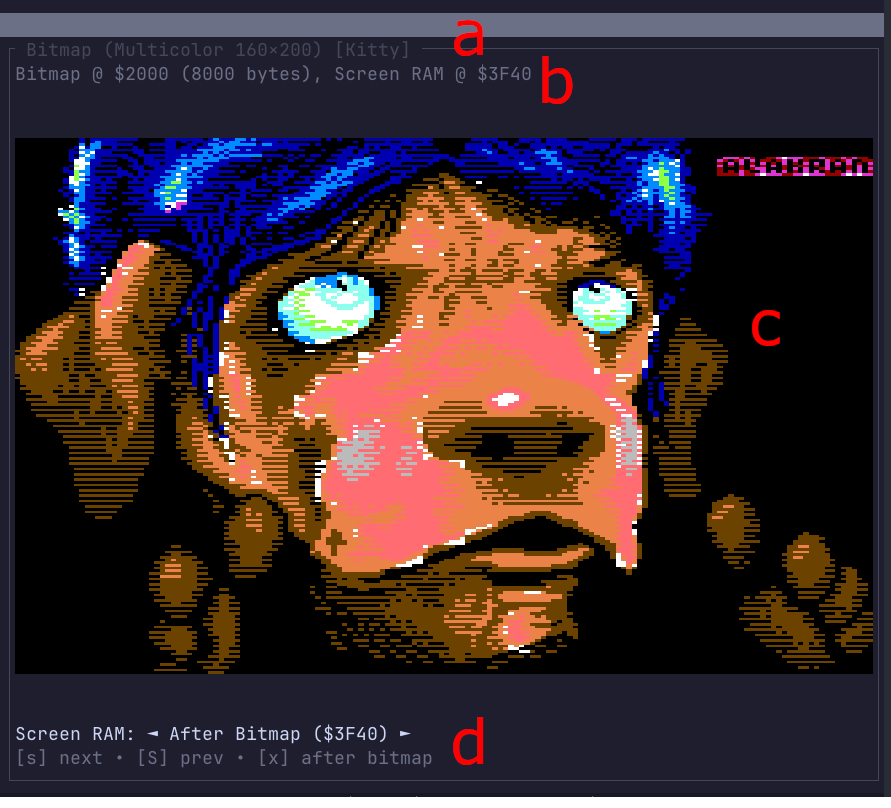
Bitmap View elements: a mode & terminal renderer · b bitmap & Screen RAM addresses · c rendered canvas · d Screen RAM selector.
| Action | Shortcut |
|---|---|
| Toggle view | Alt+5 or Ctrl+5 |
| Toggle Visual Mode | Shift+V |
| Select Bitmaps | Shift+Up / Shift+Down |
| Clear Selection | Esc |
| Convert to Byte | B |
| Toggle Multicolor | M |
| Next / Previous Screen RAM | S / Shift+S |
Screen RAM after Bitmap (+8000) |
X |
| Jump to Disassembly | Enter |
Debugger View
Press Alt+6 (or Ctrl+6) to toggle the live VICE debugger panel—showing connection state, stop reason, live disassembly around PC, configurable 64-byte Memory Dump (M), CPU registers (A, X, Y, SP, P), stack top ($0100–$01FF), active breakpoints/watchpoints, hardware vectors (NMI/RES/IRQ), and platform chip registers with change highlighting after every step.
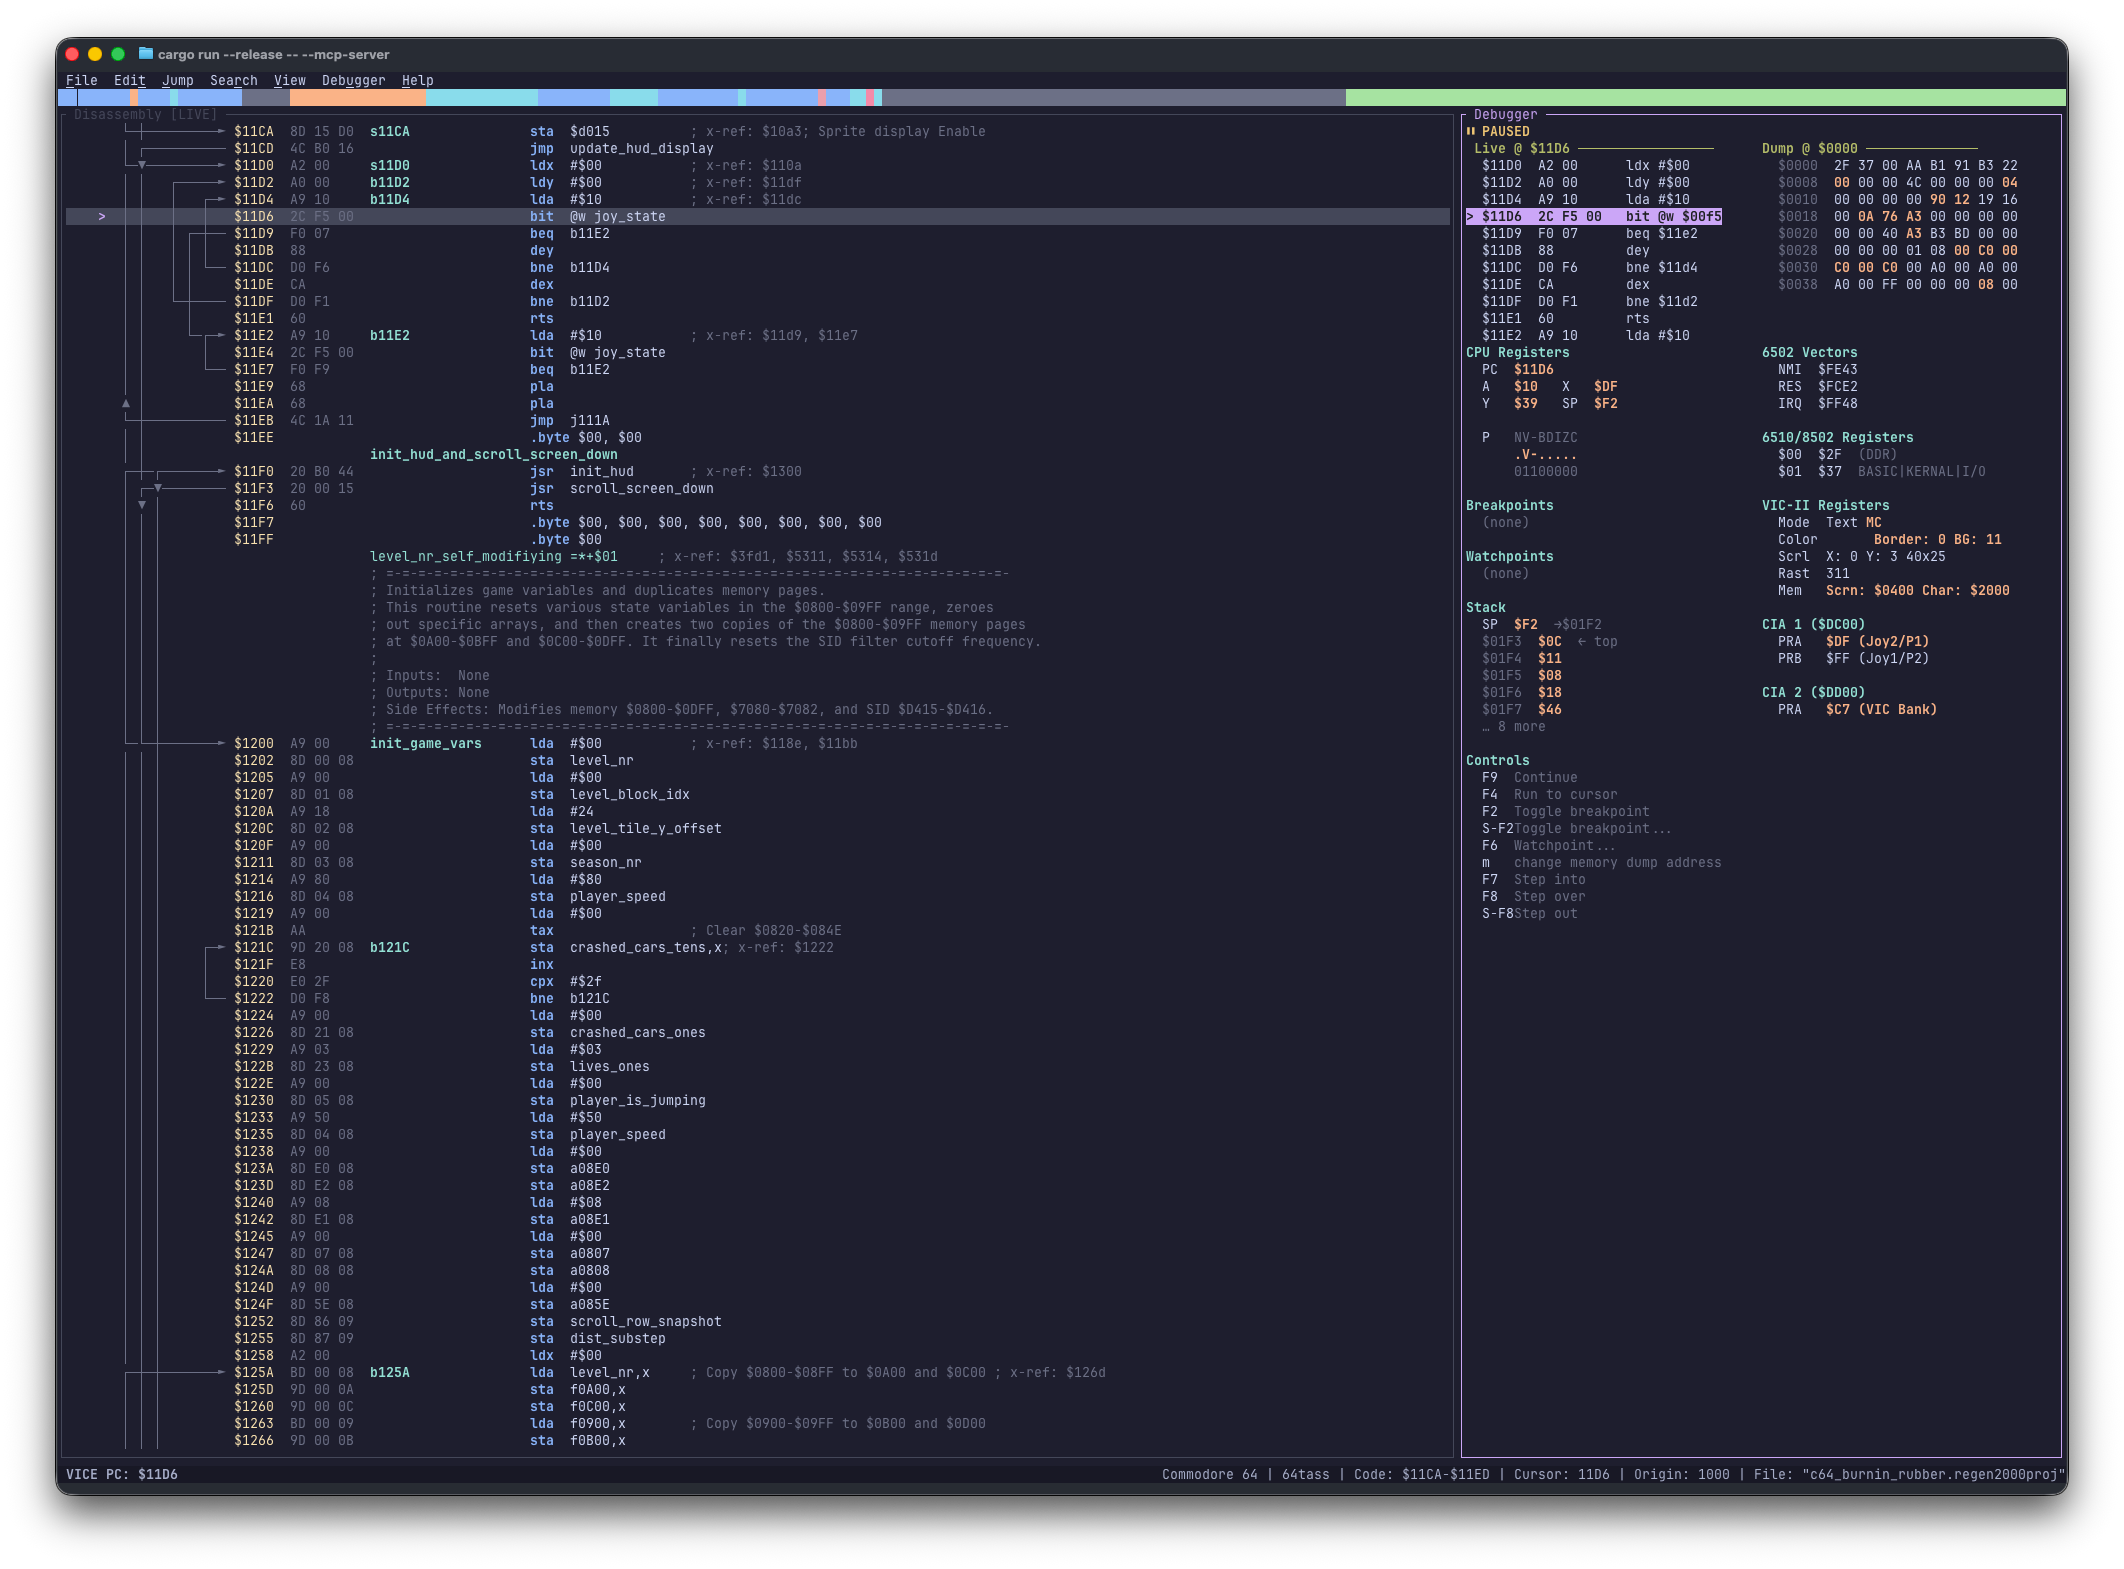
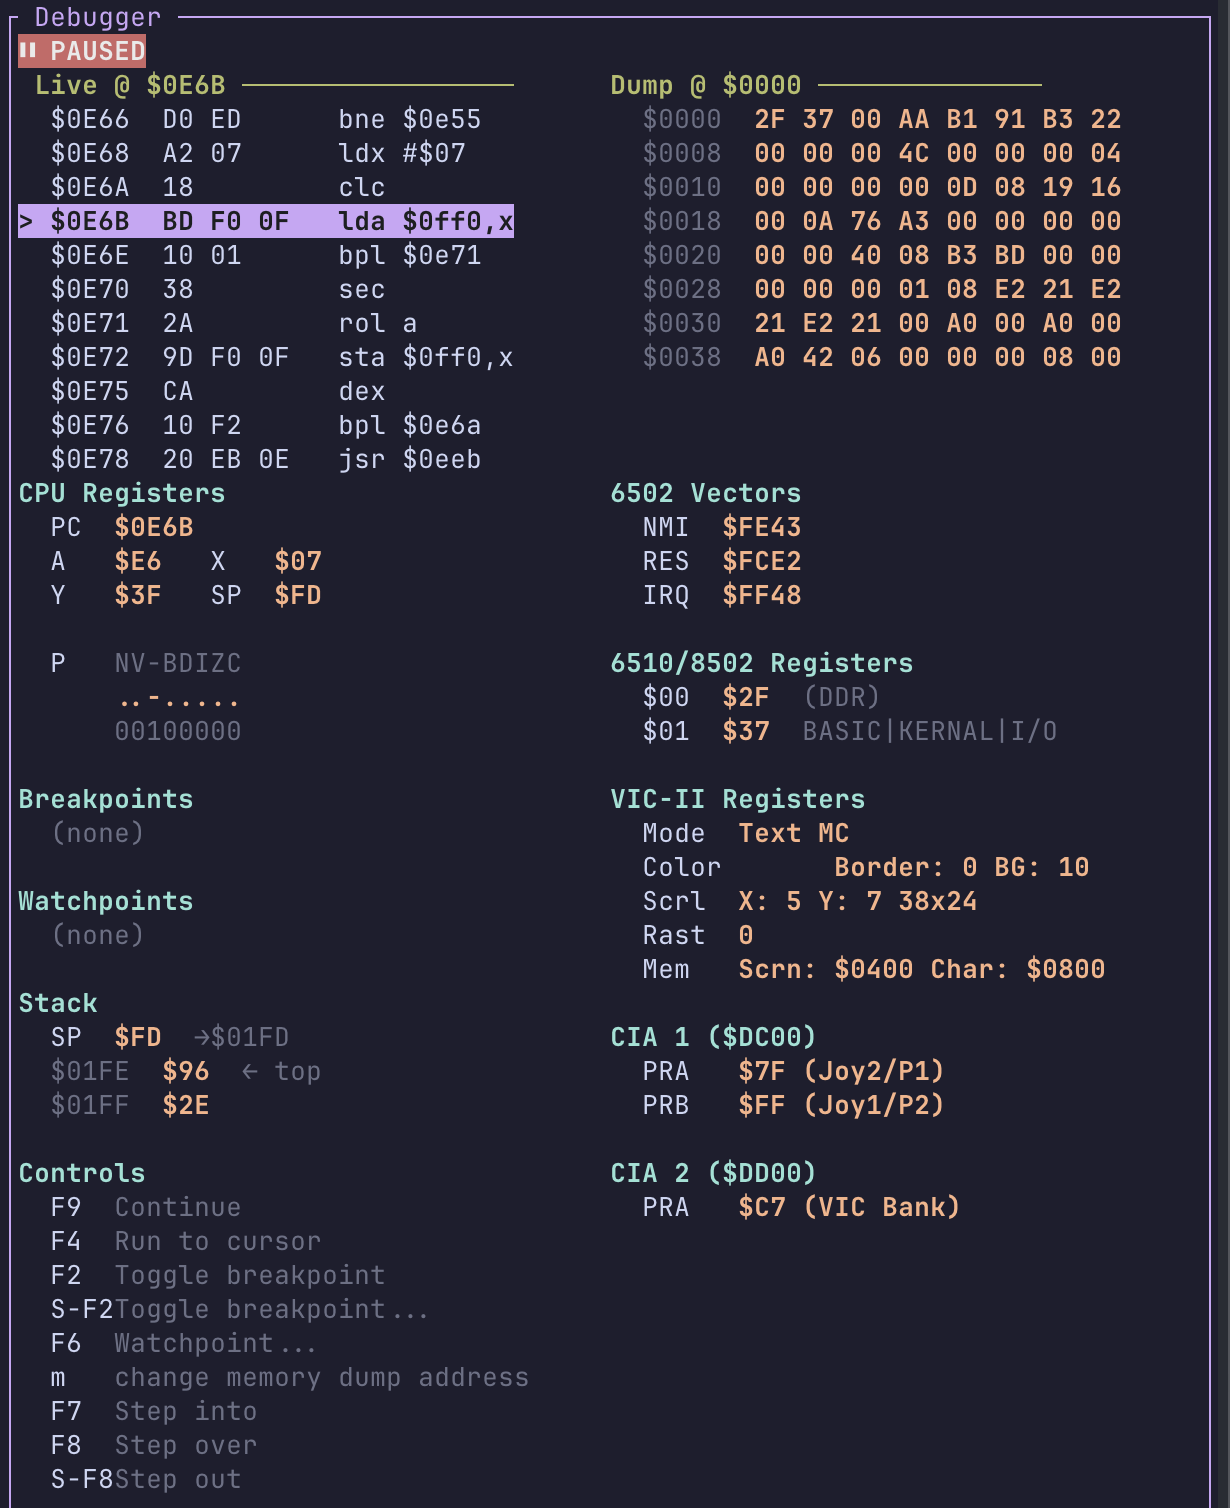
Single-column Debugger View (wide terminals arrange Stack and Hardware Registers side-by-side).
See Live Debugger (VICE) for connection instructions and full details.
| Action | Shortcut |
|---|---|
| Toggle view | Alt+6 or Ctrl+6 |
| Toggle Breakpoint | F2 |
| Toggle Breakpoint... | Shift+F2 |
| Run to Cursor | F4 |
| Watchpoint | F6 |
| Memory Dump... | M |
| Step Instruction | F7 |
| Step Over | F8 |
| Step Out | Shift+F8 |
| Run / Continue | F9 |