Guided Tutorial
Walk through a complete reverse-engineering session in Regenerator 2000—turning a raw binary into a labeled, commented, export-ready disassembly project.
Prerequisites
Install Regenerator 2000 and keep any Commodore 8-bit .prg file handy.
By the end of this walkthrough, you will know how to:
- Trace reachable code and partition raw data tables
- Name subroutines, inspect typed X-Refs, and document behavior
- Spot embedded graphics across Hexdump, Sprites, Charset, and Bitmap views
- Organize routines with scopes, splitters, and collapsed blocks
- Debug live in VICE, or hand off repetitive passes to an AI agent via MCP
The Iterative Loop
Reverse engineering works best in short passes: explore a slice, classify code or data, document what you learn, and follow the next jump.
flowchart TD
    S1["`**1. Load Binary**
    .prg · .crt · .d64 · .vsf → Auto-analyze`"]
    S2["`**2. Explore Views & X-Refs**
    Disassembly · Hex · Sprites · Charset · Bitmap`"]
    S3["`**3. Classify & Annotate**
    Code (d/c) · Data (b/w/a) · Text (p/s)
    Labels (l) · Comments (; / :) · Scopes (r)`"]
    S4["`**4. Save Project**
    Ctrl+S → .regen2000proj`"]
    Q{"Need live runtime state?"}
    VICE["`**Connect to VICE Binary Monitor**
    Breakpoints (F2) · Step (F7/F8) · Inspect Chips`"]
    S5["`**5. Export & Verify**
    .asm / .html + --verify byte-identical build`"]

    S1 --> S2
    S2 --> S3
    S3 -->|Next region| S2
    S3 --> S4
    S4 --> Q
    Q -->|Yes| VICE
    VICE -->|Update labels & notes| S2
    Q -->|No — Ready| S5
Phase 1: First Contact & Navigation
Launch Regenerator 2000 on your binary:
For raw files without headers, the Import Context dialog opens first so you can confirm the target System, Origin, and Entry Point. Once loaded, you land in the Disassembly View:
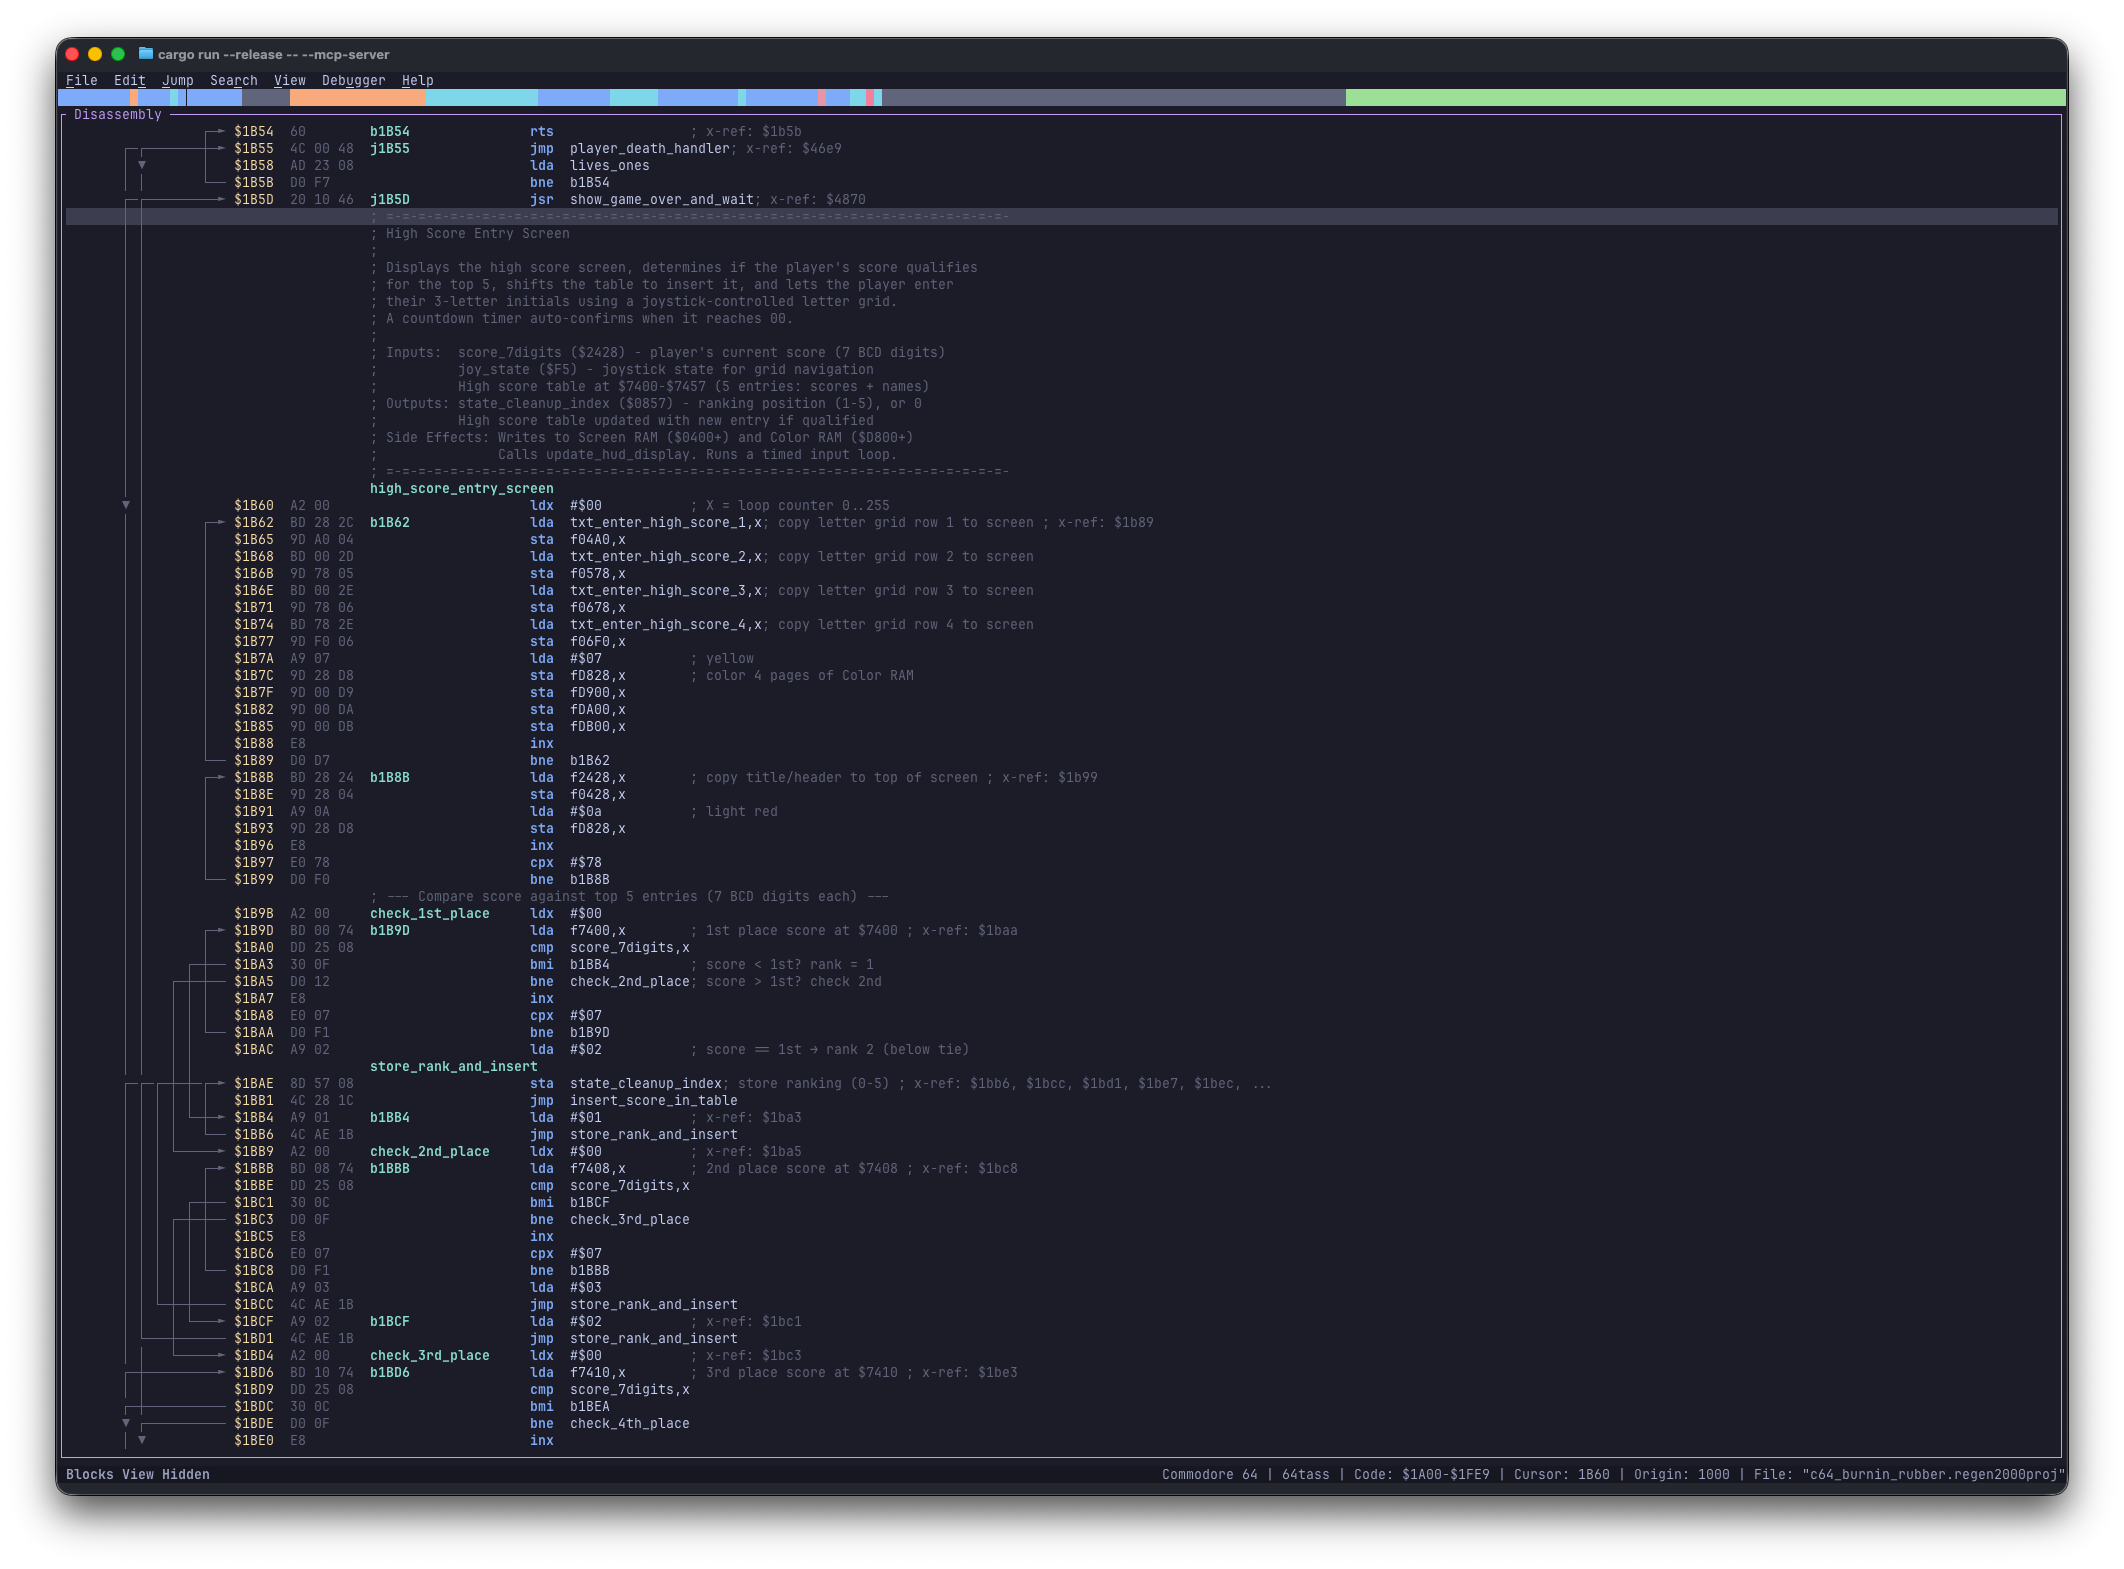
Disassembly View on the left with control-flow arrows, decoded instructions, auto-labels, and inline X-Refs.
- Grey lines: Unexplored (
Undefined) bytes waiting to be classified. - Highlighted instructions: Decoded 6502 code (unreferenced code blocks dim slightly for contrast).
- Left margin: Decimal line numbers, jump/branch arrows, and
$XXXXmemory addresses.
Essential Navigation
- Move & Page: Up / Down (or J / K), plus Page Up / Page Down.
- Jump to Address: Hit Ctrl+G, enter hex like
c000, and press Enter. - Follow Control Flow: Put the cursor on any
JMP,JSR, branch, or pointer and press Enter to jump to its target (multi-target tables open a quick picker). - Jump Back: Press Backspace to retrace your navigation history.
Auto-Analysis
With auto-analysis enabled in Settings, Regenerator 2000 automatically walks reachable flow from entry points on load—creating typed labels (s_, j_, b_), building cross-references, and resolving system KERNAL/register names. Press Ctrl+A anytime to rerun it after structural edits. See Analysis & Labels for all prefix rules.
Phase 2: Defining Code and Data
Disassembling Code (D)
Unexplored regions appear as single raw byte lines ($C000 A9 00 85 D0 ...). Put your cursor on a suspected entry point and press D—flow analysis follows branches and JSR calls until hitting invalid opcodes or returns (RTS/RTI), cleanly skipping data tables tucked between subroutines.
Converting Data with Visual Mode (Shift+V)
When raw tables or graphics were mistakenly decoded as instructions or BRK padding, convert them back to data:
- Press Shift+V to start Visual Mode, then highlight the range with Up / Down (or J / K).
- Press B for Bytes (
.byte $00, $01...), W for Words (.word $1000...), A for Addresses, P for PETSCII, or S for Screencode text. - Press Esc anytime to cancel selection without changes.
When to Use Visual Mode
- Mark sprite/charset blocks as Bytes (B).
- Select an even byte range for Lo/Hi (<) or Hi/Lo (>) split address tables.
- Convert embedded menus or high-score strings to PETSCII (P) or Screencode (S).
Phase 3: Labels & Cross-References
Replacing hex addresses with readable names makes every caller across the program click into place:
- Put your cursor on
$C015(or any label/operand) and press L. - Type
main_loopand press Enter.
Every instruction referencing $C015 now reads JMP main_loop.
Local vs. Global Labels
Inside the label dialog, press Tab to focus the scope checkbox and Space to toggle Local vs. Global—ideal for short loop targets inside a subroutine.
Inspecting X-Refs & Symbols
- Inline X-Refs: Check the trailing
; x-ref: $0820, $0850comments on referenced lines. - Find References (Ctrl+X): Opens a list of every caller with typed badges (
[R],[W],[R/W],[C],[J],[O])—press Enter on any row to jump there. - Go to Symbol (Ctrl+P): Type any part of a label name to filter and jump straight to it.
Phase 4: Comments & Bookmarks
Press ; to attach a short inline note to the right of an instruction:
Press : to insert a block header above an address:
Use Shift+Enter or Ctrl+J for newlines, and Alt+-, Alt+=, or Alt+\ inside the dialog for ---, ===, or -=- divider bars.
- Press Ctrl+B to drop or remove a bookmark at the current address.
- Press Ctrl+Shift+B (or Alt+B) to open the Bookmarks dialog and jump between saved spots.
All bookmarks are saved inside .regen2000proj.
Phase 5: Searching
Press /, type text, and hit Enter to search across labels, mnemonics, operands, and comments. Step through hits with N (next) and Shift+N (previous).
Press Ctrl+F for structured searches:
- Text: Matches labels, comments, and instructions.
- Hex Pattern: Searches raw bytes like
A9 00 8D(supports??single-byte wildcards). - PETSCII / Screencode: Finds encoded text strings anywhere in memory.
Step through matches afterward with F3 / Shift+F3.
Phase 6: Graphics & Data Views
Switch to any companion view in the right pane (Tab moves focus between panes) to visually spot non-code regions:
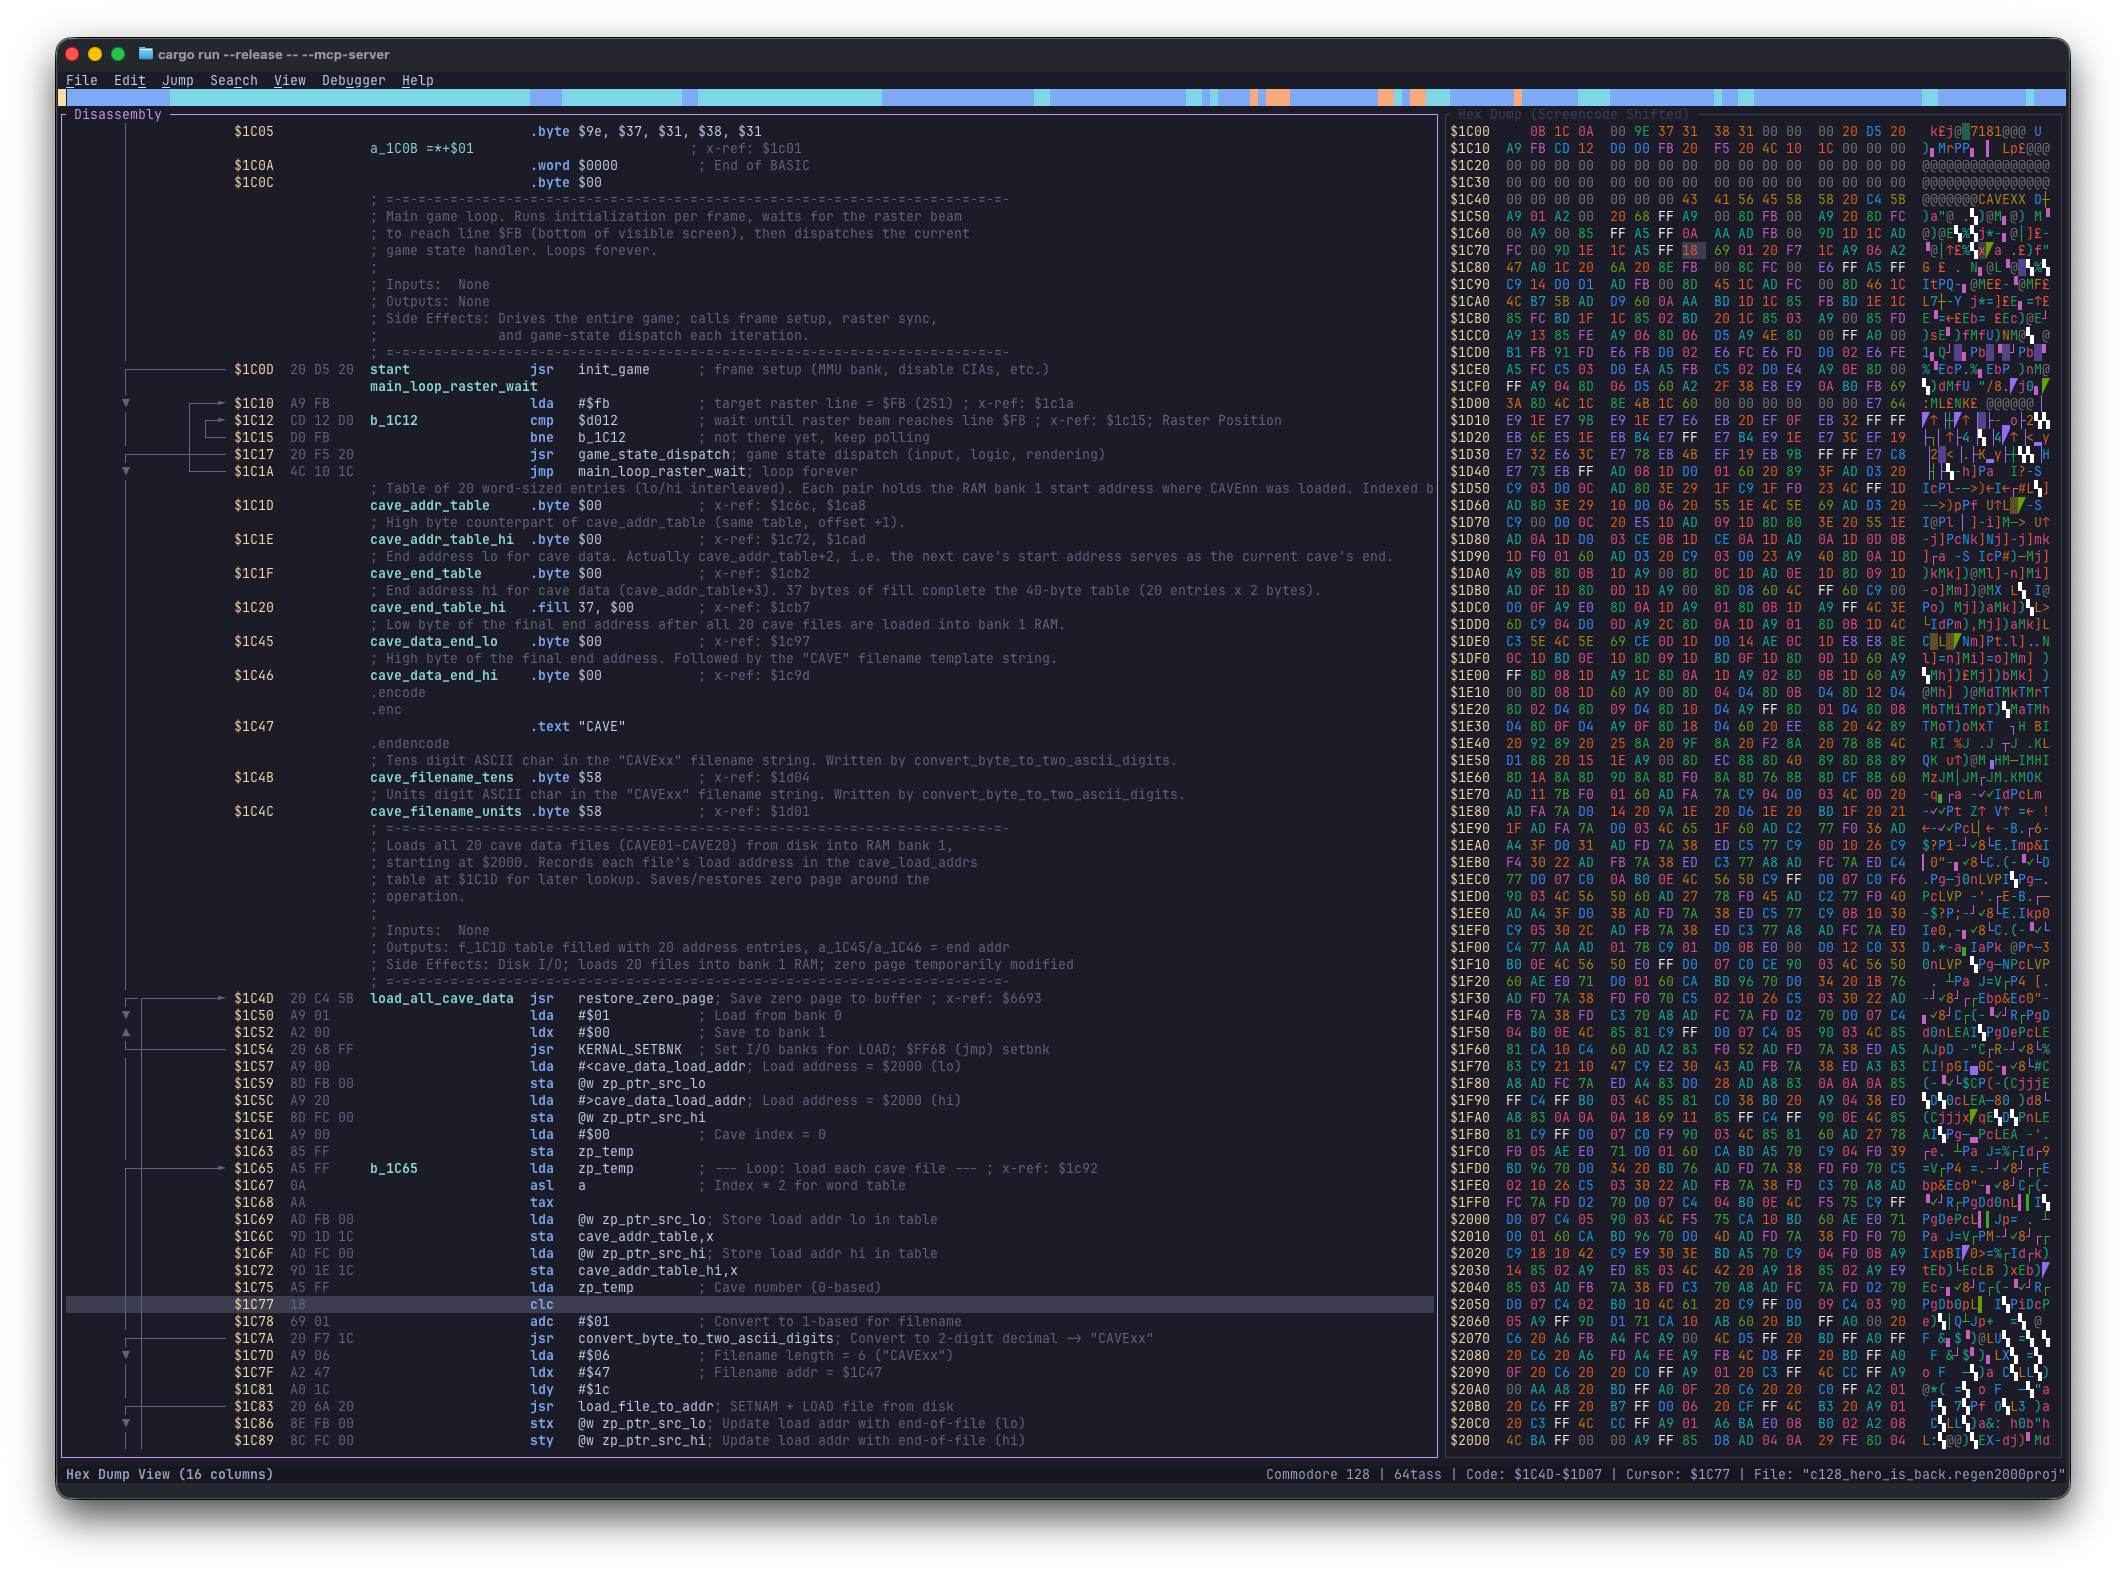
Byte-value color highlighting ($00 dim, $FF bright) makes tables and strings stand out. Press M to cycle PETSCII/Screencode decoding.
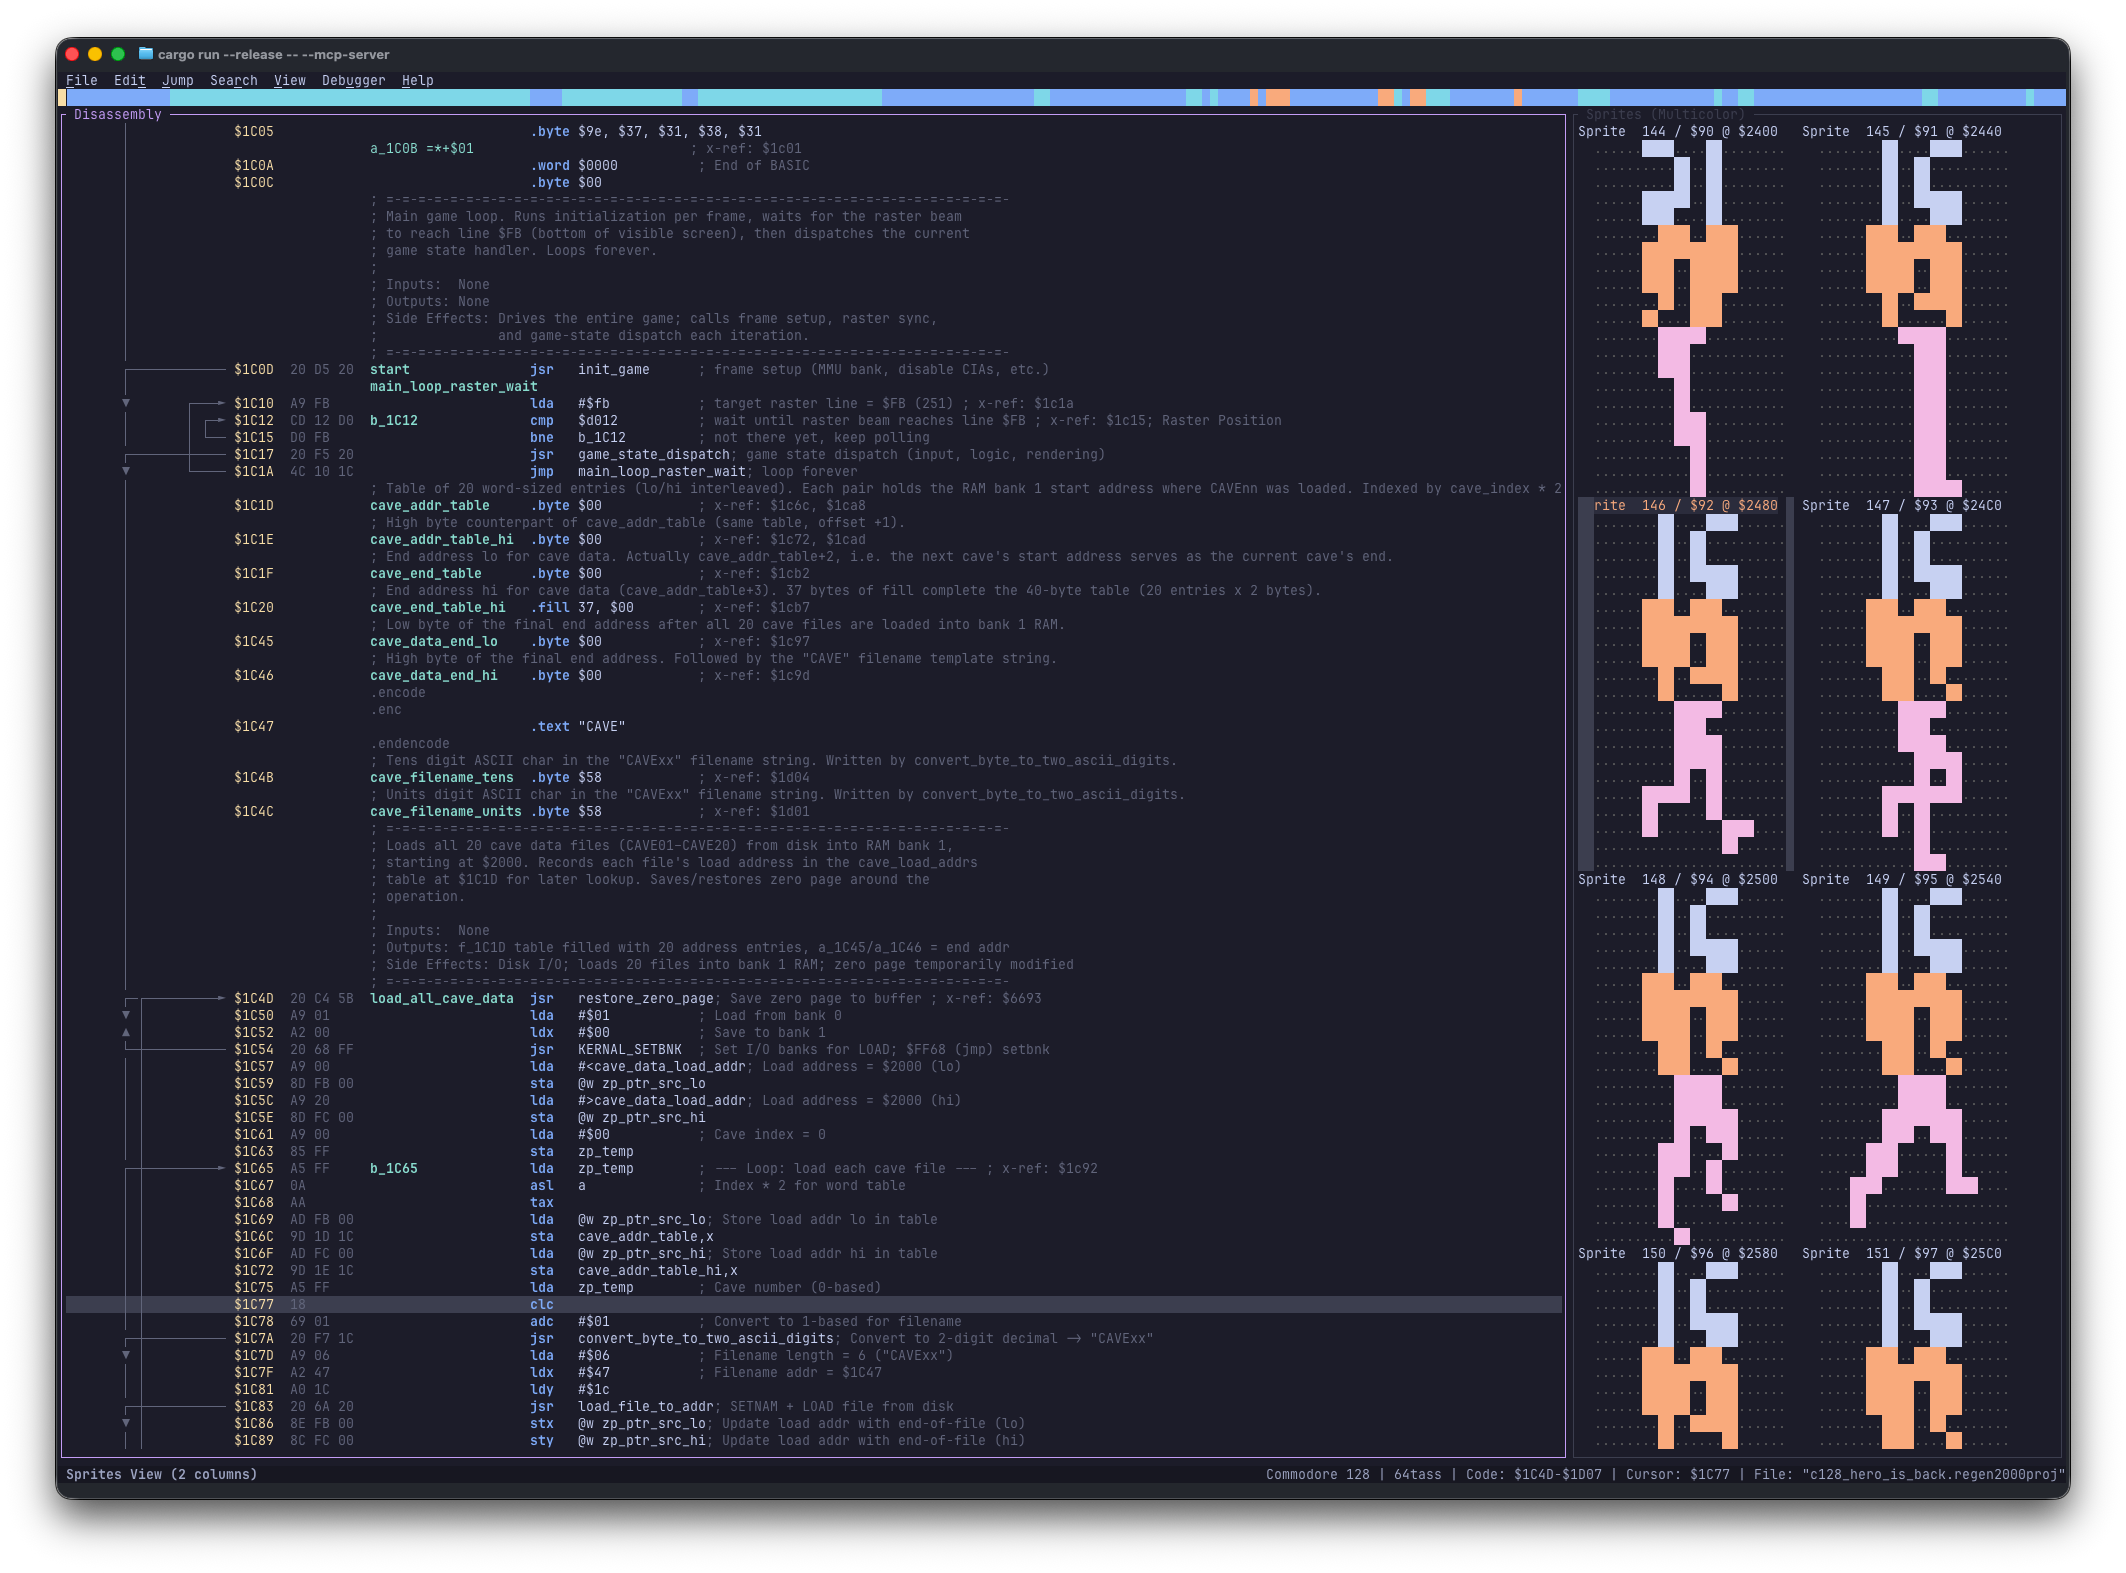
Previews 64-byte chunks as 24×21 sprites. Press M to toggle multicolor mode and B to mark confirmed sprites as Byte blocks.
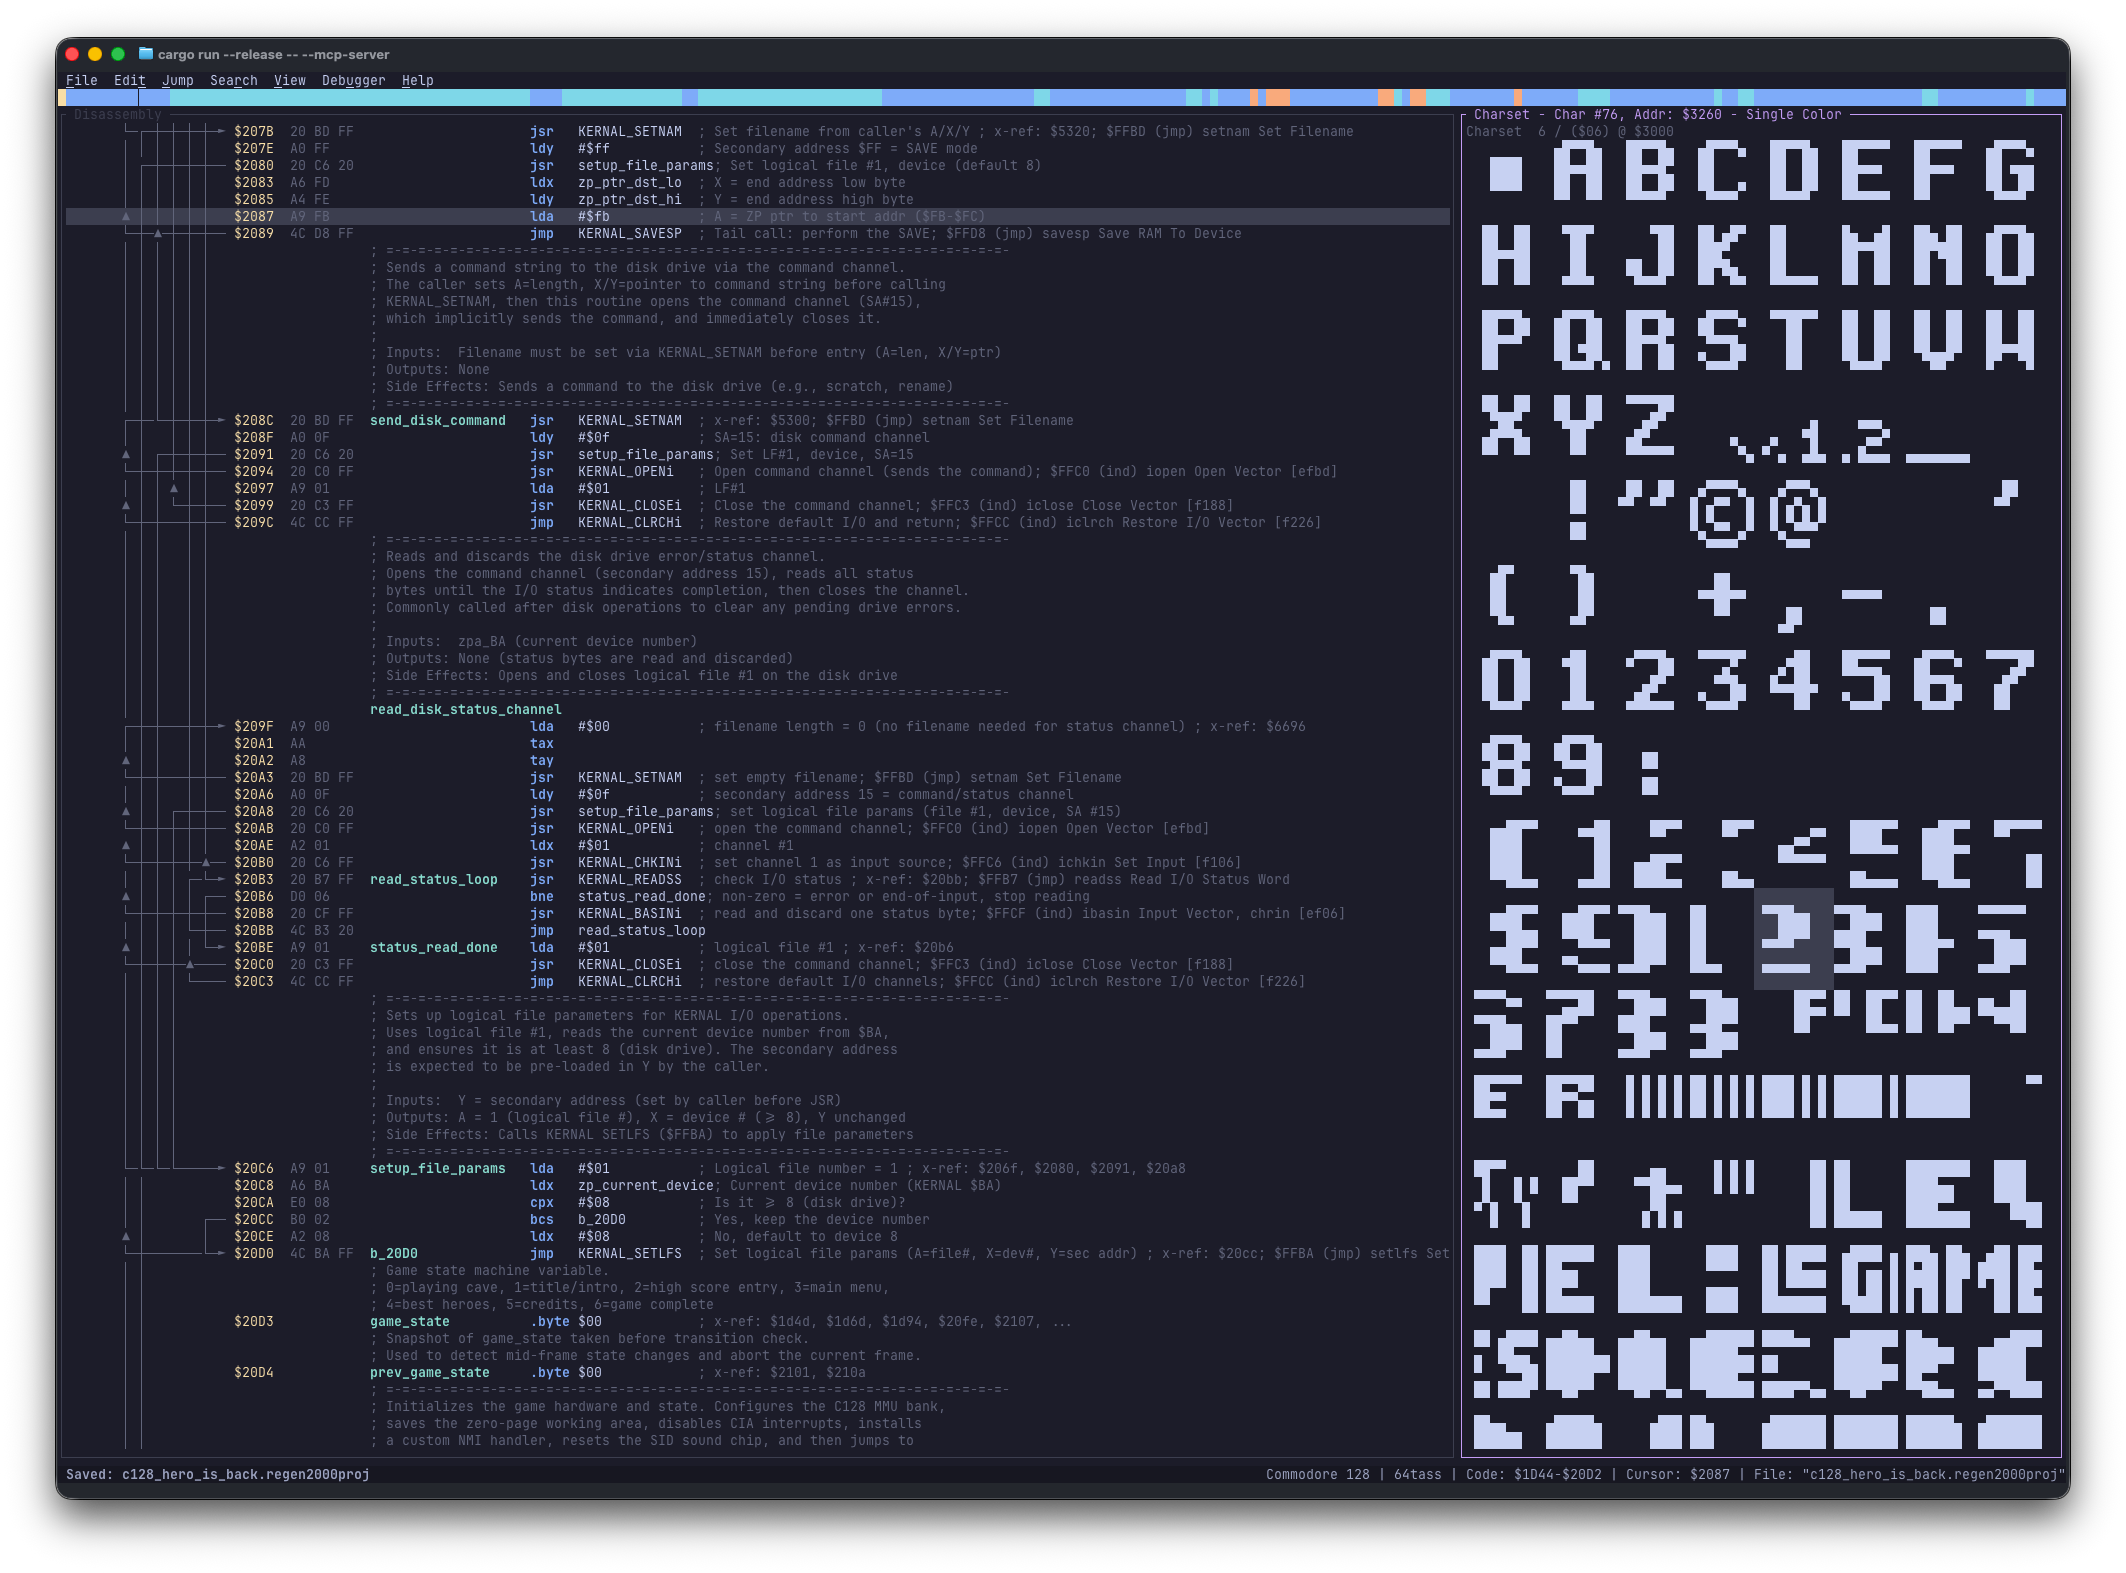
Scans memory as 8×8 character tiles in high-res or multicolor mode (M) to locate custom fonts.
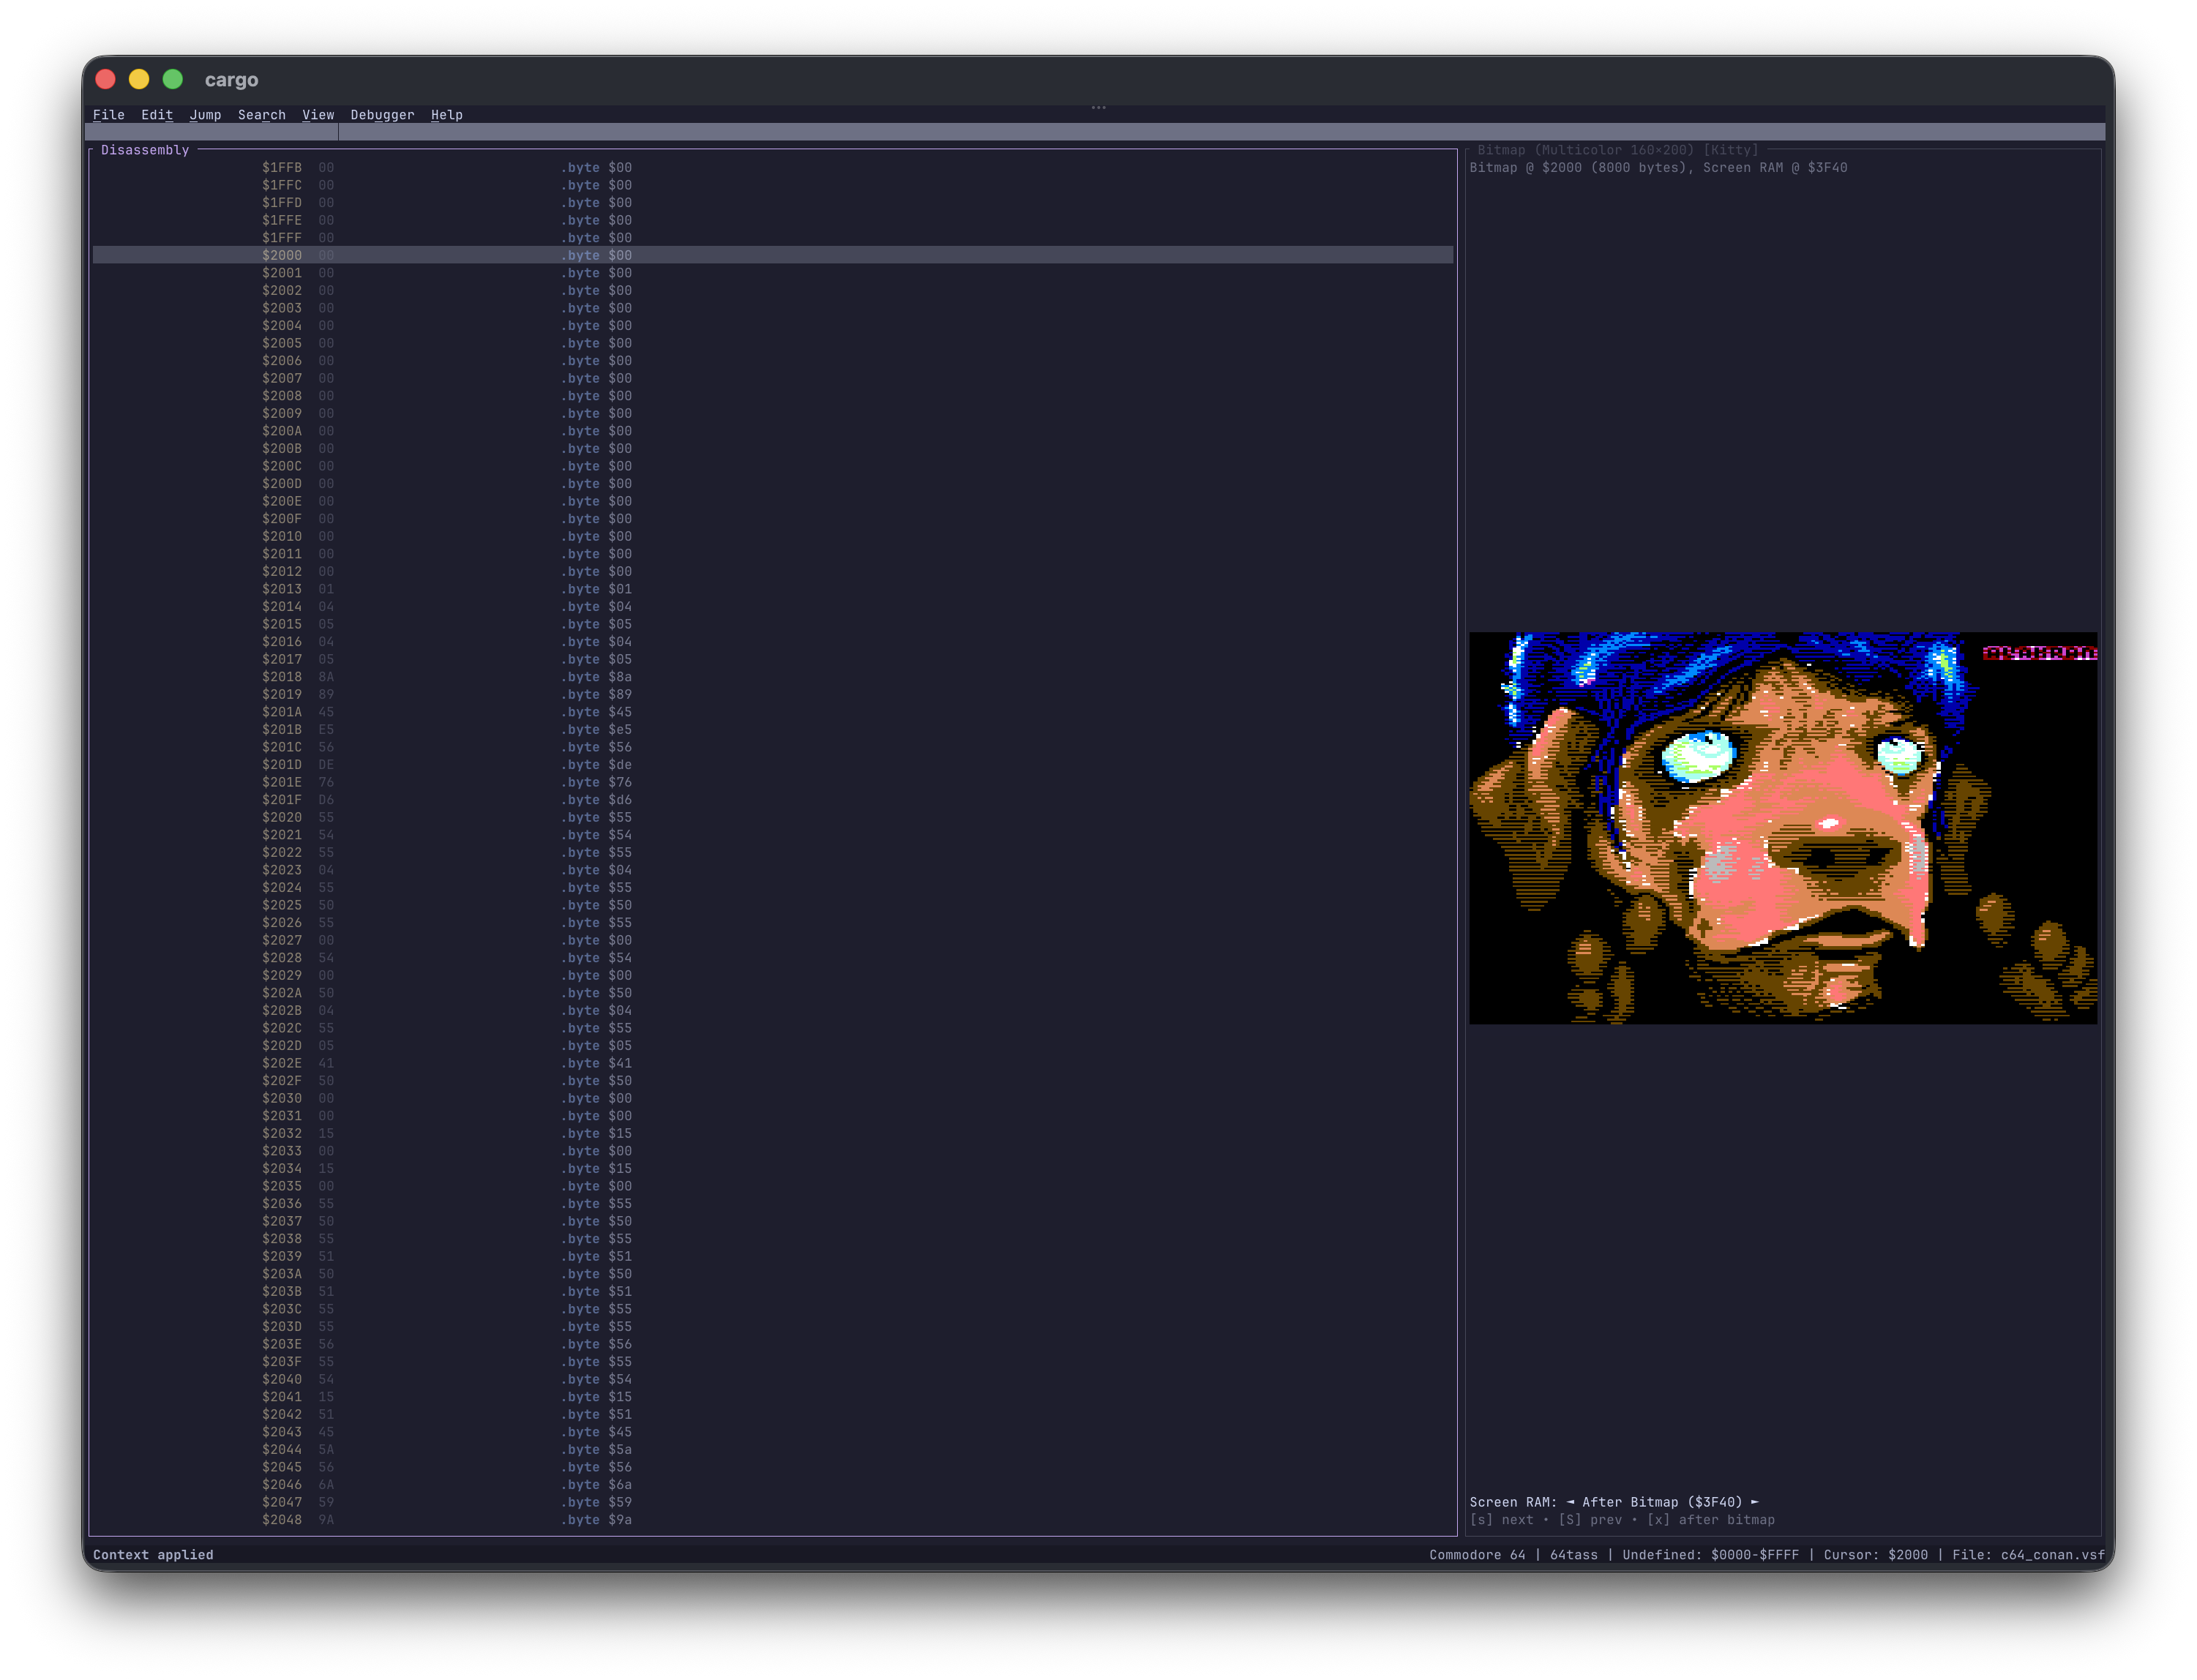
Renders 320×200 or 160×200 bitmaps with selectable Screen RAM overlays (S / Shift+S or X for +8000).
Syncing Views
When view synchronization is enabled in Settings, moving in the Disassembly View keeps the active right pane aligned to the same address.
Phase 7: Scopes, Splitters & Collapsed Blocks
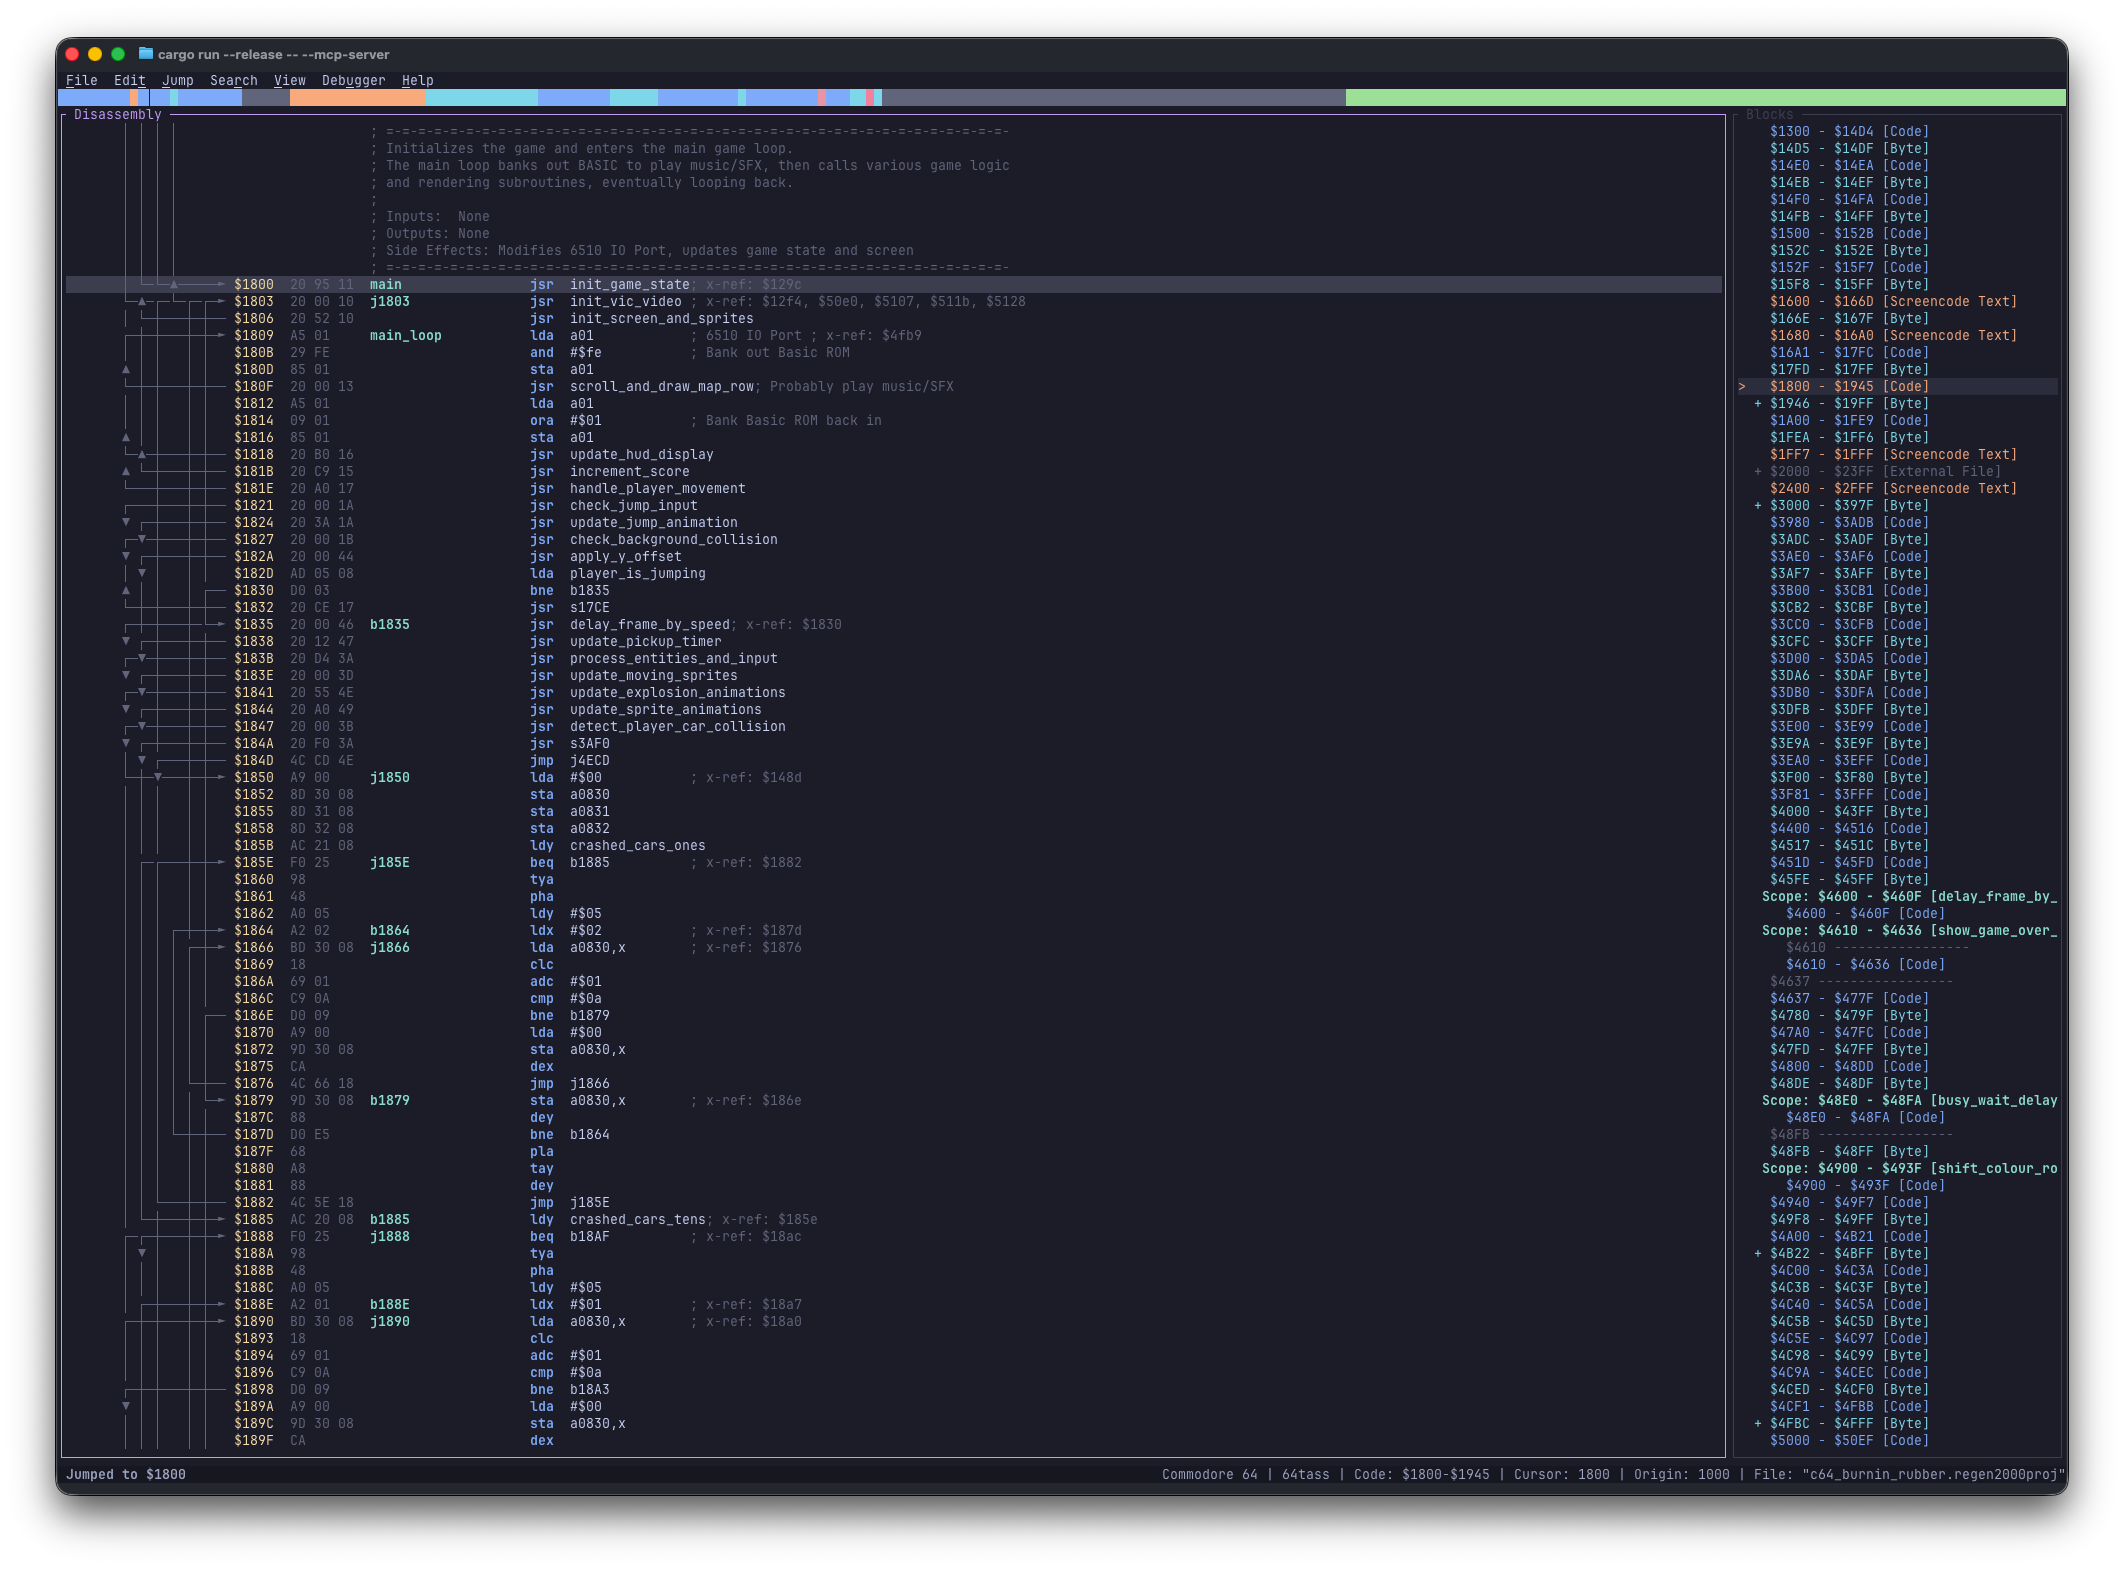
The Blocks View (Alt+1) maps every Code, Data, Undefined, Scope, and Splitter region across your binary.
Scopes
Press R (on a line or Visual selection) to wrap a routine in a lexical scope (.block/.bend in 64tass, .proc/.endproc in ca65, {/} in KickAssembler), keeping local labels isolated. Press Del at a scope boundary to remove it.
Splitters
Regenerator 2000 auto-merges adjacent blocks of the same type. Press | at a boundary address to insert a splitter so two consecutive tables (especially Lo/Hi or Hi/Lo tables!) stay separate. Line comments (:) also split adjacent Address and Word tables.
Collapsing Blocks
Press Ctrl+K to fold a large data table or finished subroutine into a single summary line in the TUI—leaving exported .asm output untouched.
Phase 8: Saving & Exporting
- Save Project (Ctrl+S): Writes your binary, blocks, labels, comments, bookmarks, and undo history to
.regen2000proj. - Export ASM (Ctrl+E): Generates assembly for 64tass, ACME, KickAssembler, or ca65 (pick your target assembler and fill-run threshold in Document Settings, Alt+D).
For build scripts and CI pipelines, export or verify from the command line in headless mode:
# Export to ASM or interactive HTML
regenerator2000 --headless --export_asm output.asm my_game.regen2000proj
regenerator2000 --headless --export_html output.html my_game.regen2000proj

# Override target assembler and verify byte-identical roundtrip assembly
regenerator2000 --headless --assembler acme --export_asm output.asm my_game.regen2000proj
regenerator2000 --verify my_game.regen2000proj
Phase 9: Live Debugging with VICE
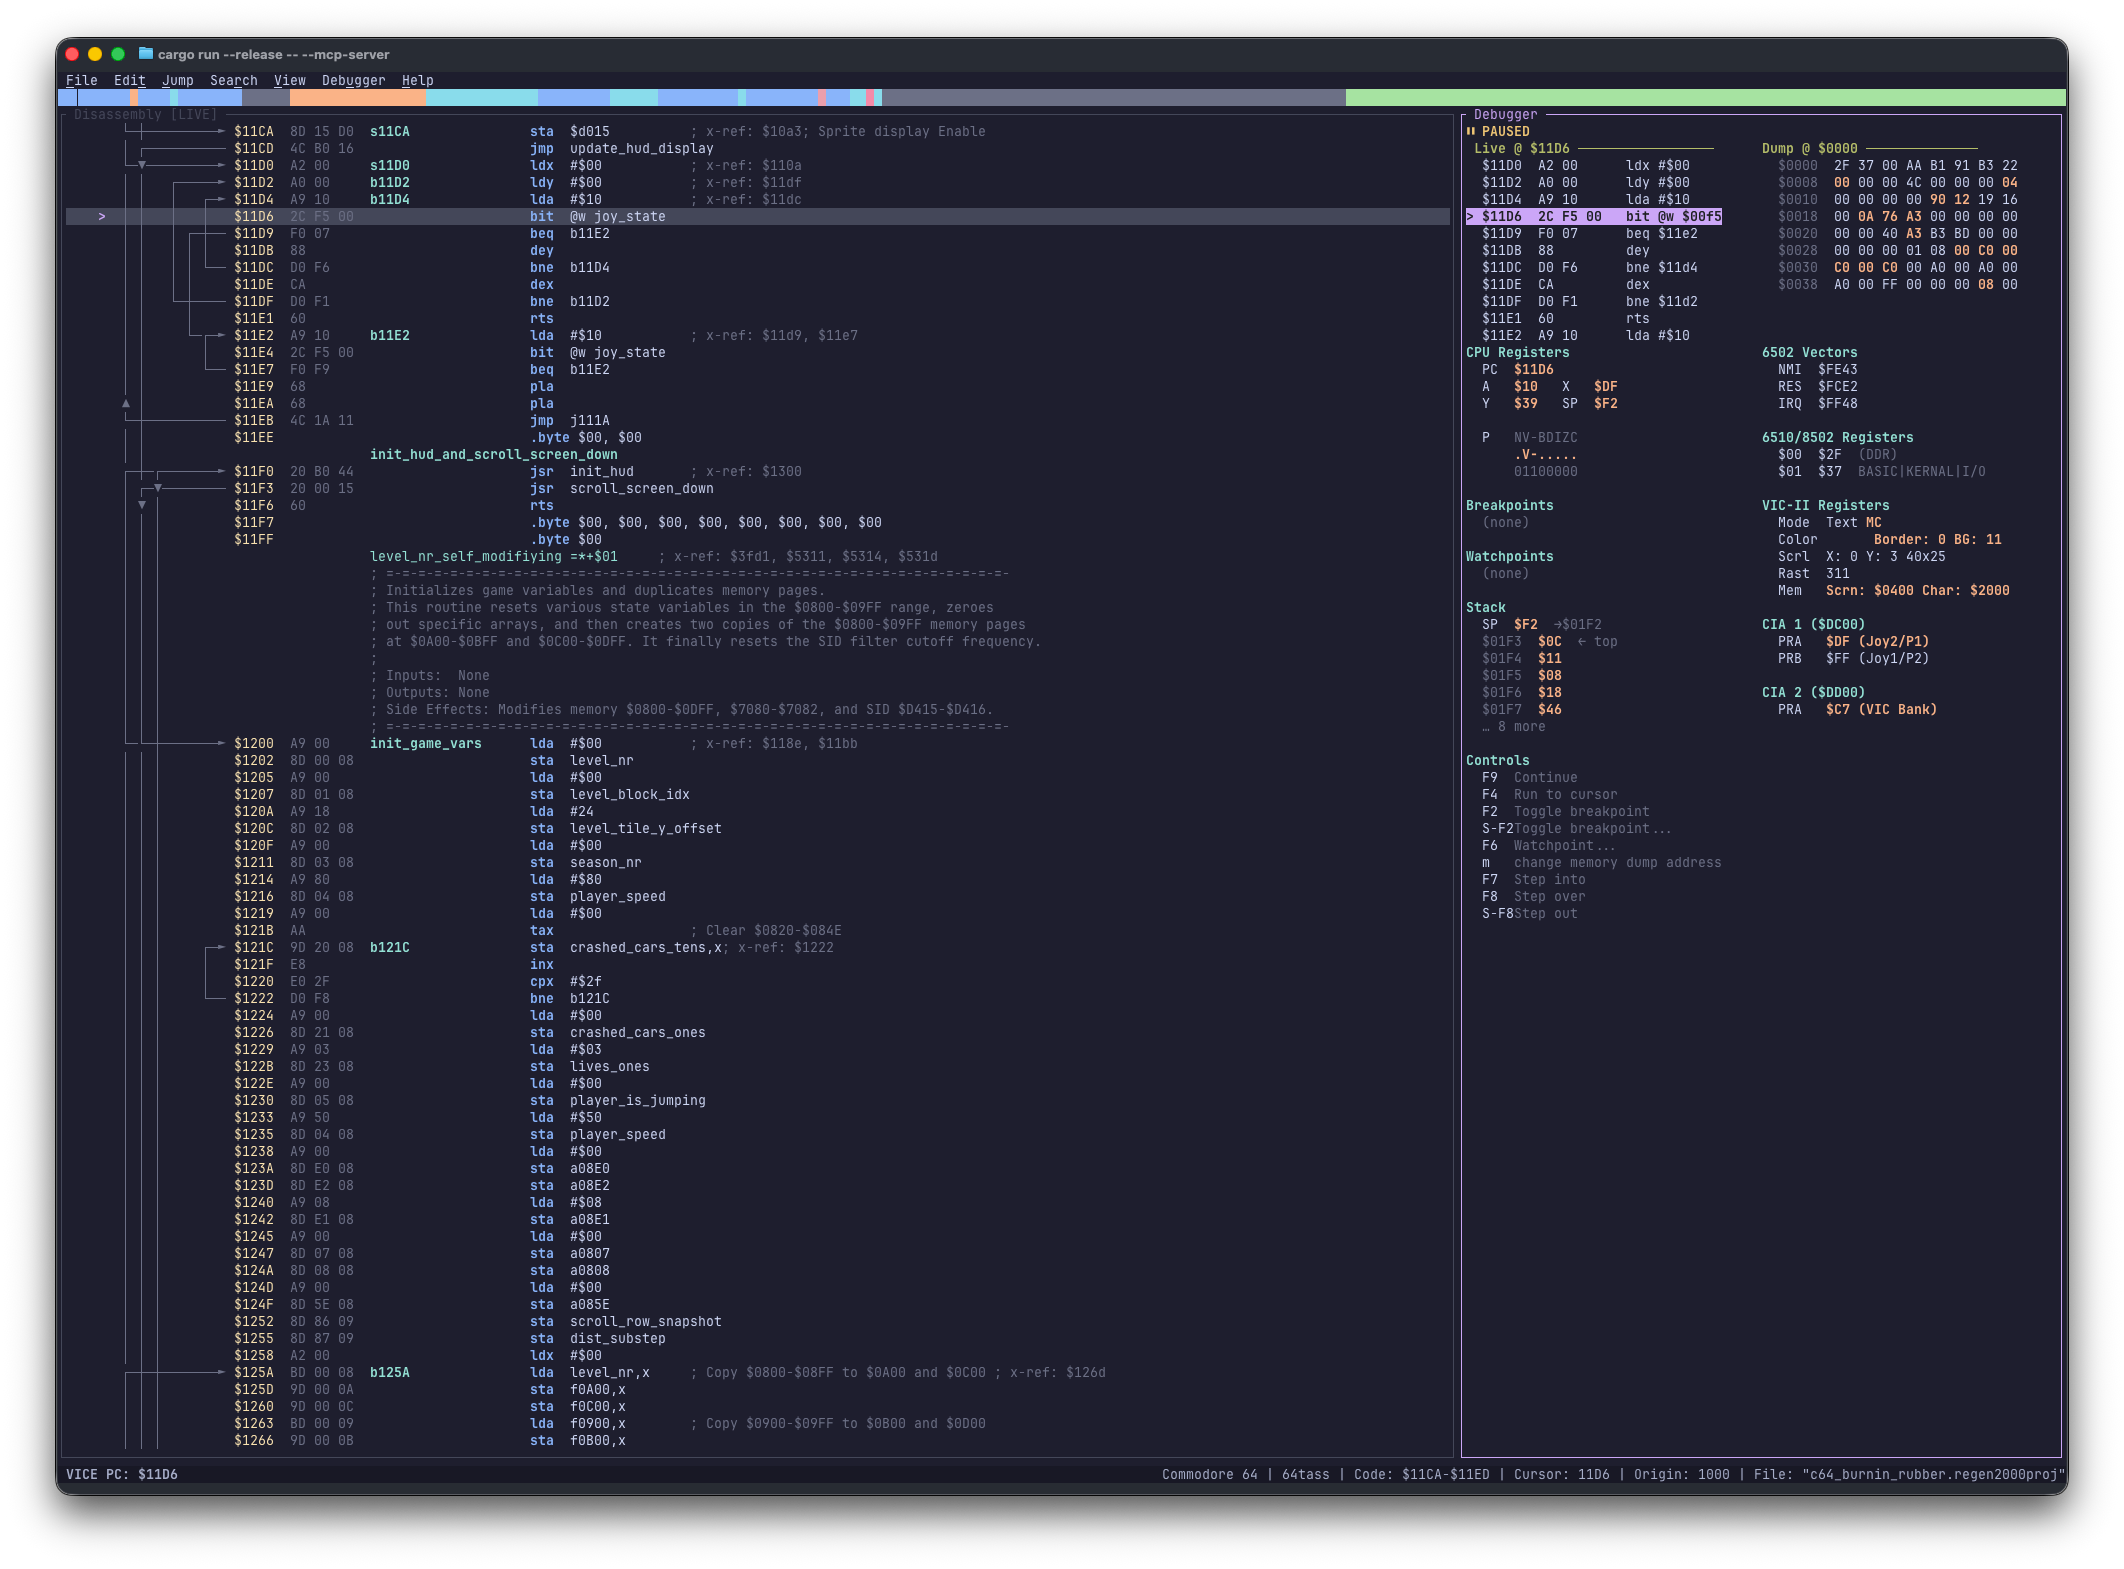
Live Debugger View (Alt+6) showing CPU registers, stack, VIC-II/CIA hardware chips, breakpoints, and live PC disassembly.
-
Start VICE with its binary monitor enabled and launch Regenerator 2000 on the exact same binary:
(Or connect anytime from Debugger → Connect to VICE...)
-
Open the Debugger pane with Alt+6 (or Ctrl+6).
- Toggle execution breakpoints (F2 / Shift+F2) or memory watchpoints (F6), resume with F9, run to cursor (F4), and step with F7 (Into), F8 (Over), or Shift+F8 (Out)—updating labels and comments as runtime behavior reveals itself.
Keep Binaries Identical
VICE and Regenerator 2000 must load the exact same .prg; mismatched binaries misalign PC addresses and breakpoints.
Phase 10: AI-Assisted Analysis (MCP)
Launch Regenerator 2000 with --mcp-server and point Claude Code or Antigravity at http://127.0.0.1:3000/mcp to let an AI assistant decode BASIC headers, partition unknown blocks, trace routines, and rename variables right inside your live TUI. See MCP Integration for setup and the 5 analysis skills.
Next Steps
- Keyboard Shortcuts — Complete shortcut reference by pane and mode.
- Block Types and Helpers — Deep dive into every block directive and immediate helper.
- Live Debugger (VICE) — Memory dumps, chip registers, and watchpoint tips.
- MCP Integration — Pair-reverse-engineering setup with AI agents.