Debugger (VICE Integration)
Connect Regenerator 2000 directly to the VICE emulator over its Binary Monitor Protocol to step instructions, inspect live registers and chip state, and set breakpoints or watchpoints right from the Disassembly View.
Connecting to VICE
Run the Exact Same Binary
VICE and Regenerator 2000 must run the identical binary so program counter (PC) addresses and breakpoints align.
Launch VICE with -binarymonitor (default TCP port 6502) and pass --vice to Regenerator 2000:
# Terminal 1: Start VICE with binary monitor enabled
x64 -binarymonitor my_program.prg

# Terminal 2: Start Regenerator 2000 and auto-connect
regenerator2000 --vice localhost:6502 my_program.prg
If you changed VICE's port with -binarymonitoraddress, pass the matching <HOST:PORT> to --vice.
- Start VICE with
-binarymonitor(x64 -binarymonitor my_program.prg). - In Regenerator 2000, open Debugger → Connect to VICE....
- Confirm
localhost:6502(or your custom host/port) and press Enter. - Press Alt+6 (or Ctrl+6) to open the Debugger pane, then Tab to focus it.
Debugger Panel Contents
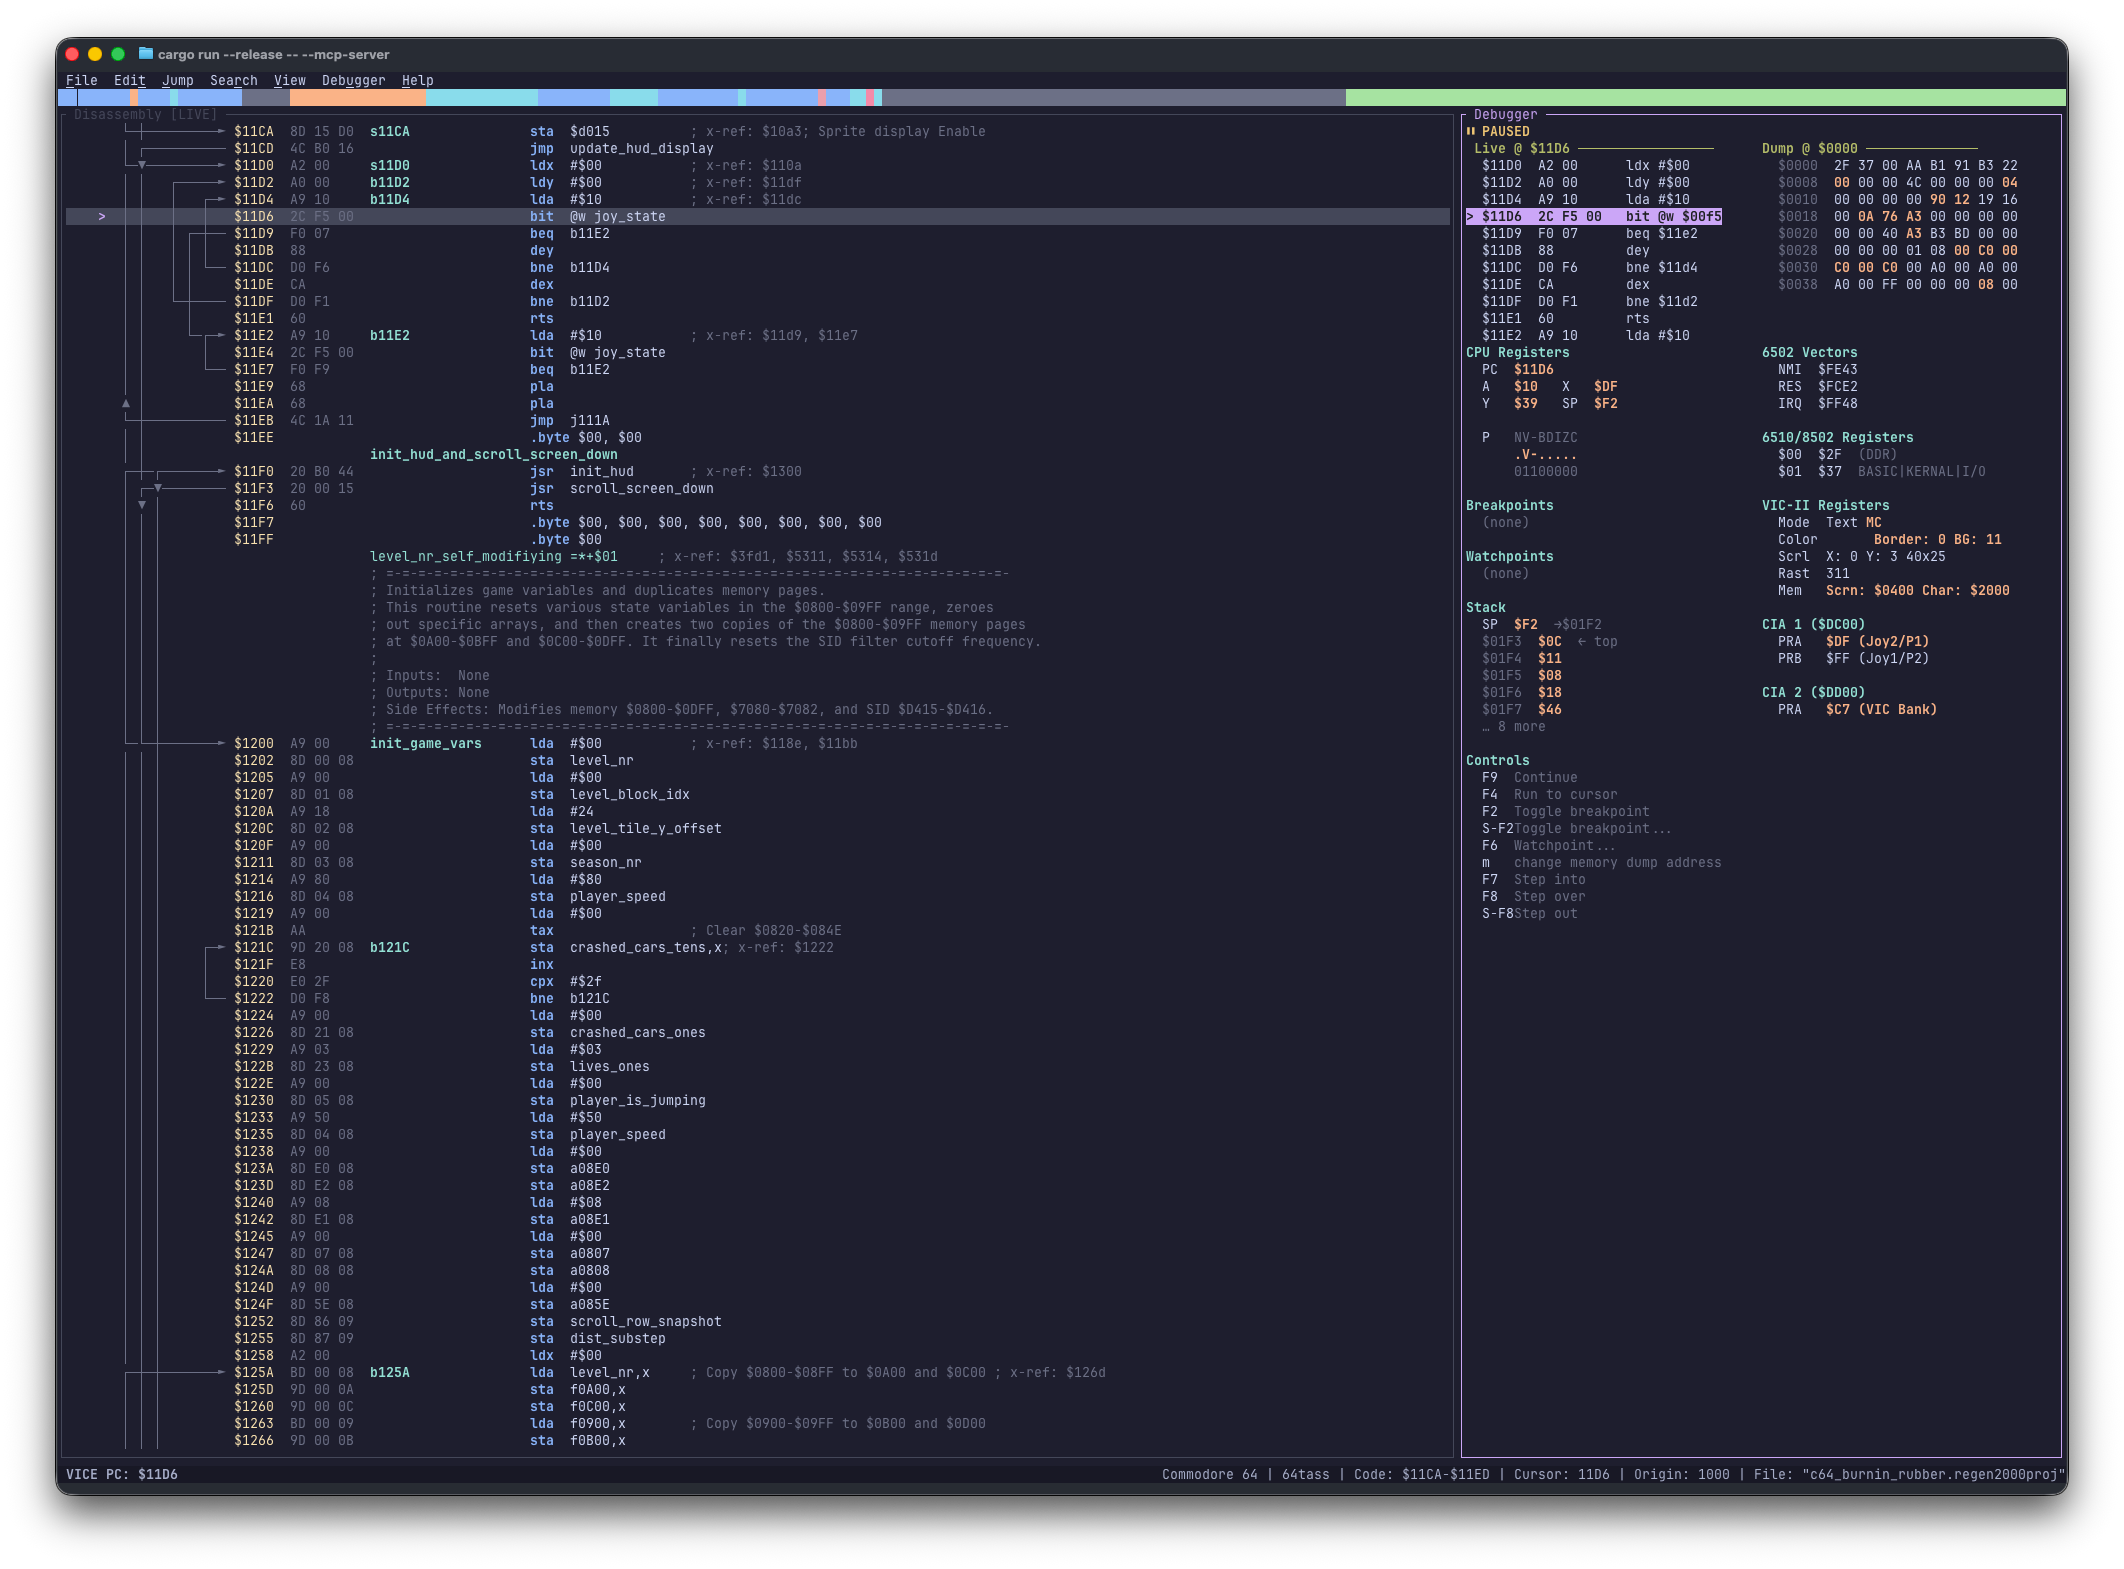
When connected, the main Disassembly View highlights the active PC and marks active breakpoints, while the right-hand Debugger pane shows:
- Connection & Live Disassembly
- Shows connection state (
RUNNING/PAUSEDplus stop reason such as a triggered watchpoint) and disassembly centered on the currentPC. - CPU Registers & Stack
- Displays
A,X,Y,SP, andPstatus flags, plus the top 5 entries from the hardware stack ($0100–$01FF). - Hardware Registers & Vectors
- Displays 6502 vectors (
NMI$FFFA,RESET$FFFC,IRQ$FFFE) alongside platform chips: 6510/8502$00/$01port, VIC-II, CIA 1 & CIA 2 (C64/C128), VIC-I$9000–$900F(VIC-20), and TED$FF00–$FF3F(Plus/4). - Change Highlighting
- Highlights any register, memory byte, stack entry, or vector modified on the latest step.
- Breakpoints & Watchpoints
- Lists active execution breakpoints and memory read/write watchpoints registered in VICE.
- Memory Dump (64 bytes)
- Displays an 8×8 byte hex grid at any address when paused—focus the Debugger pane, press M, and enter a hex address (such as
0400orD000). Refreshes automatically on every step.
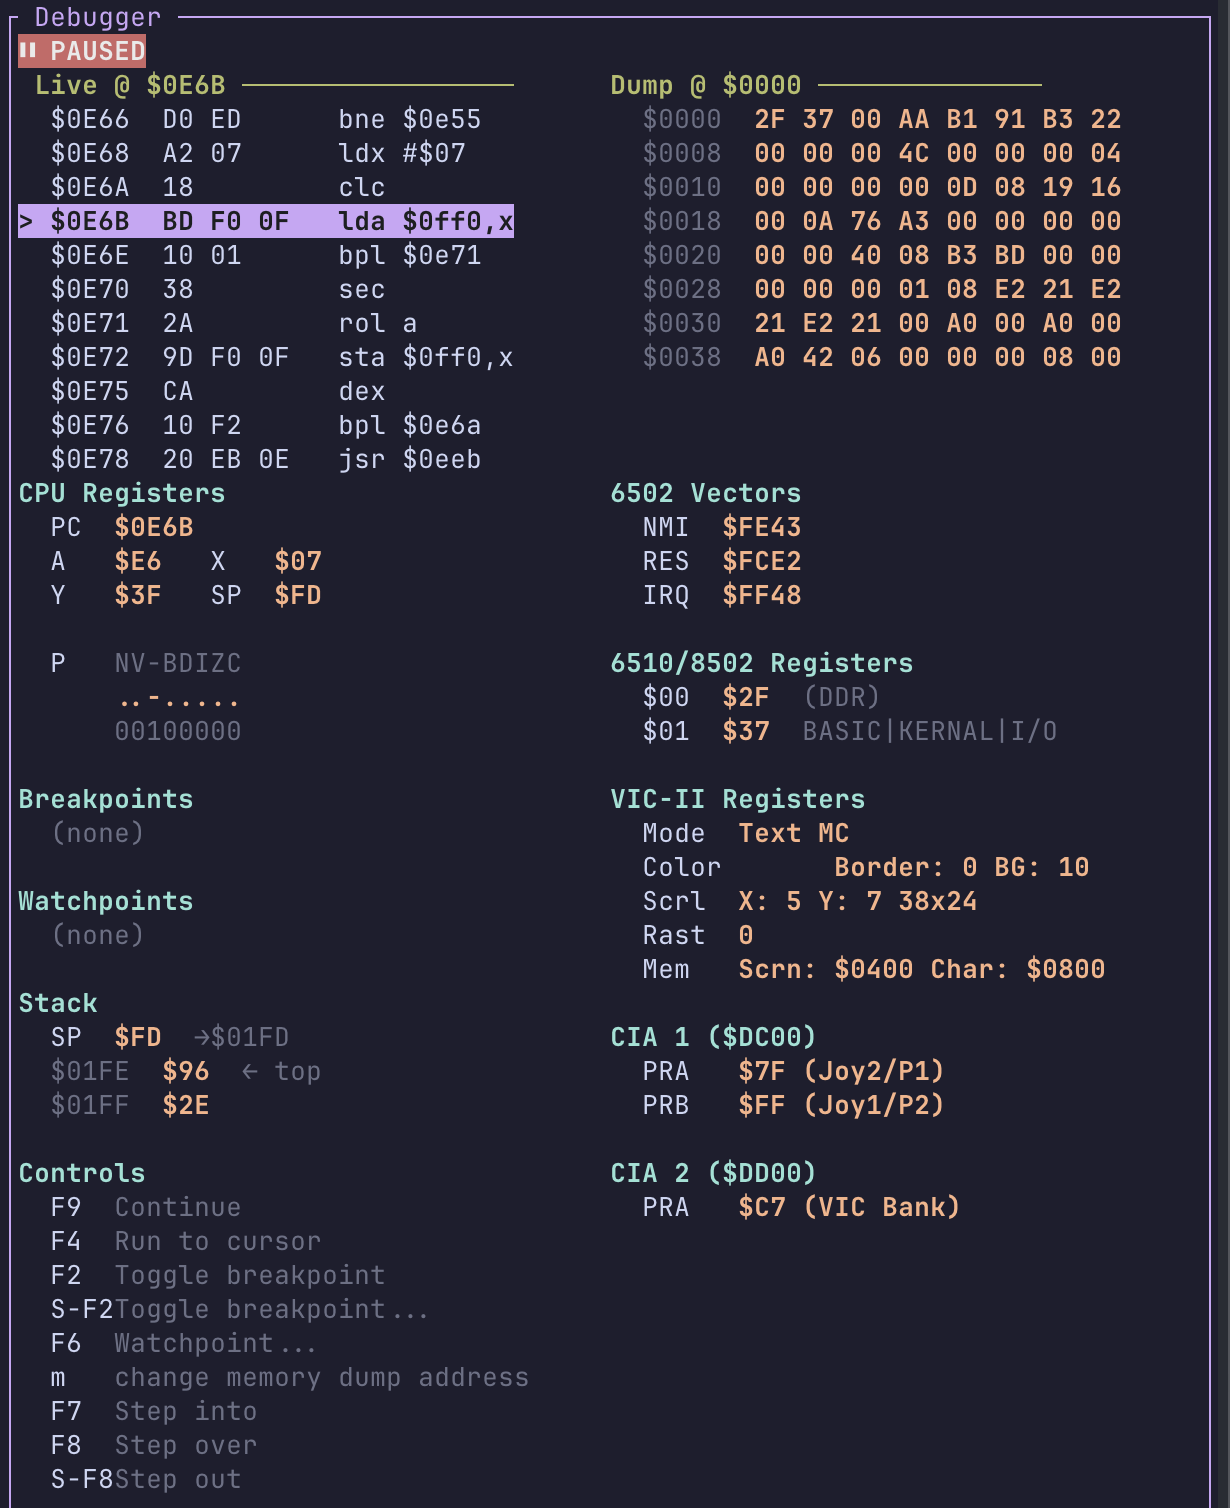
Single-column Debugger View (wide terminals lay out Stack and Hardware Registers side-by-side).
Keyboard Shortcuts
All controls are also available under the Debugger menu (see Keyboard Shortcuts):
| Action | Shortcut |
|---|---|
| Toggle Breakpoint | F2 |
| Toggle Breakpoint... (address) | Shift+F2 |
| Watchpoint | F6 |
| Run to Cursor | F4 |
| Memory Dump... (focus Debugger pane) | M |
| Step Into | F7 |
| Step Over | F8 |
| Step Out | Shift+F8 |
| Run / Pause (Continue) | F9 |
Select Debugger → Disconnect from VICE anytime to detach cleanly.